

Keeping vLLM Production Quality: A Look Inside CI, Benchmarking, and the Release Process
Intro
vLLM is the most widely used open-source LLM inference engine. 86K+ GitHub stars. 5.6M+ monthly pip installs. 2.5M+ monthly image pulls, with support for 1000+ model architectures and 600+ accelerator types.
Supporting this many models and accelerators has always been one of vLLM's biggest strengths. It's also what makes it so hard to keep stable.
In June 2026, vLLM merged 1,918 commits into main — 64 a day on average, on par with other big OSS projects like PyTorch or Kubernetes. During this time, our CI ran 13 million job minutes with 1400 concurrent runners at peak.
Testing vLLM, especially at this pace, gets harder every day. A change that's clean on an H100 might fail to compile on AMD, lose throughput on B200, or nudge a model's outputs just enough on one backend to matter. The surface area that makes vLLM worth using is the exact surface area we have to defend on every commit.
In this post, I want to share how we keep vLLM releases stable at this pace: what works, what we've learned, and where we still fall short. It will mostly cover high-level processes rather than technical details; I'll save those for another post.
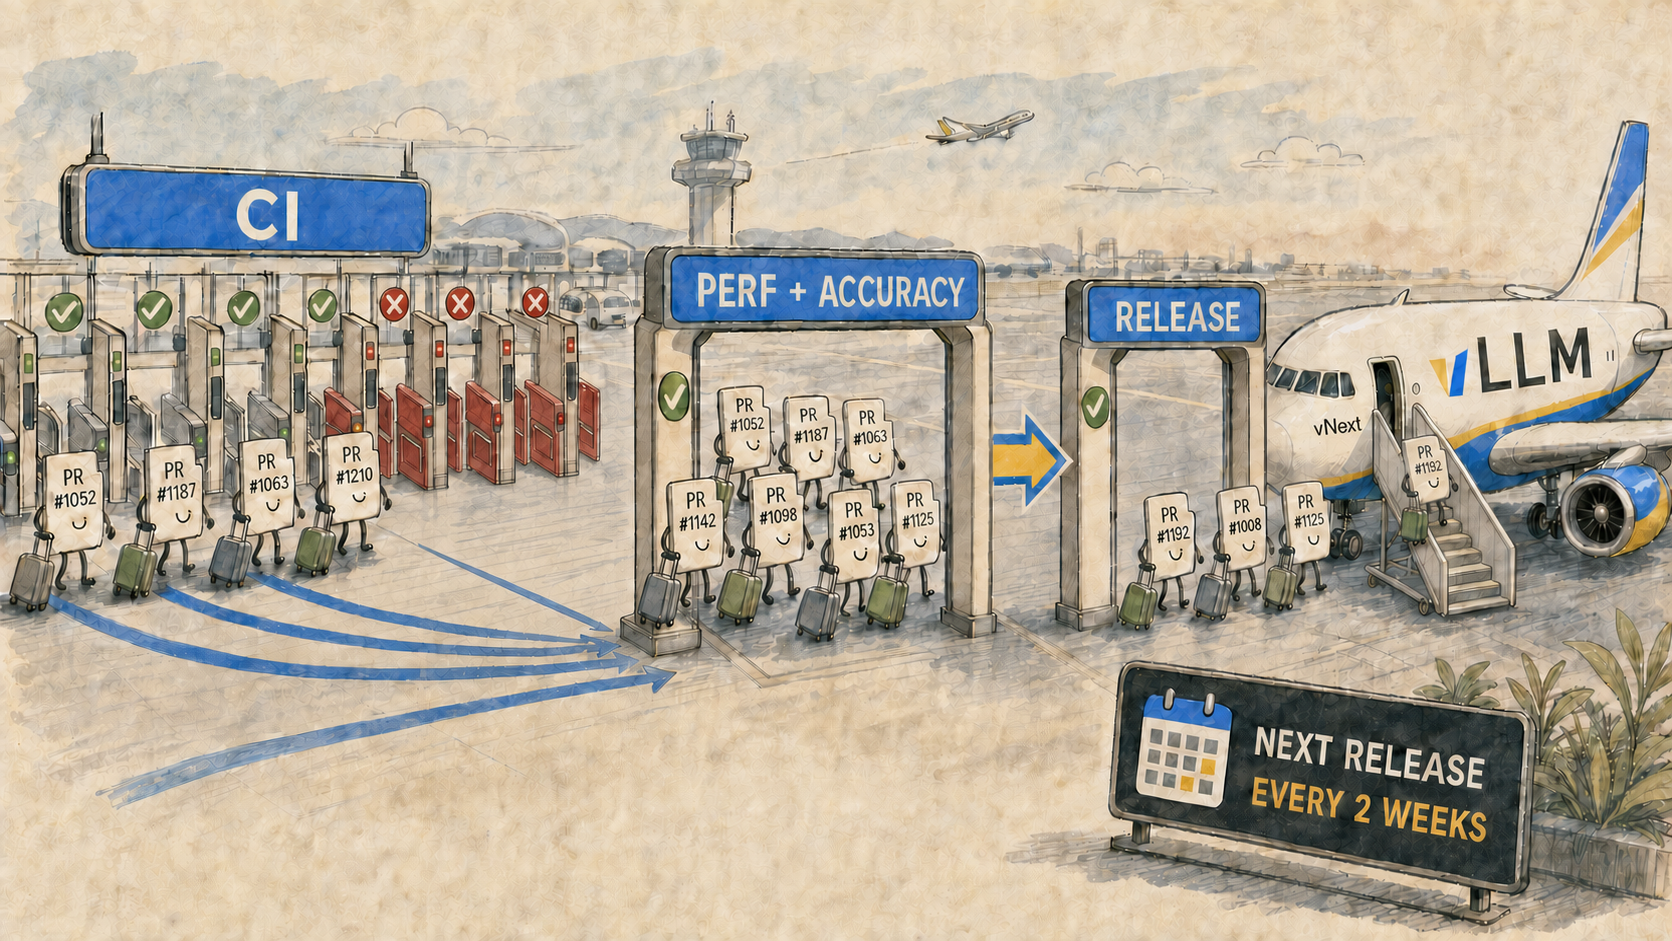
A journey from pull requests to a new version release on vLLM has to go through three layers:
-
CI — how we catch what breaks loudly, on every PR
-
Performance benchmarking & accuracy evaluation — how we catch what breaks silently, beyond what CI can cover
-
Release process — how we evaluate the signals, make the call, then build and ship artifacts to users safely.
Layer 1: CI
Extensive unit testing on every component of the codebase
Every PR starts with lightweight GitHub Actions checks—linting, formatting, and similar guardrails. Once a committer thinks the PR is ready to merge, the heavier unit testing then starts running on Buildkite, our CI platform.
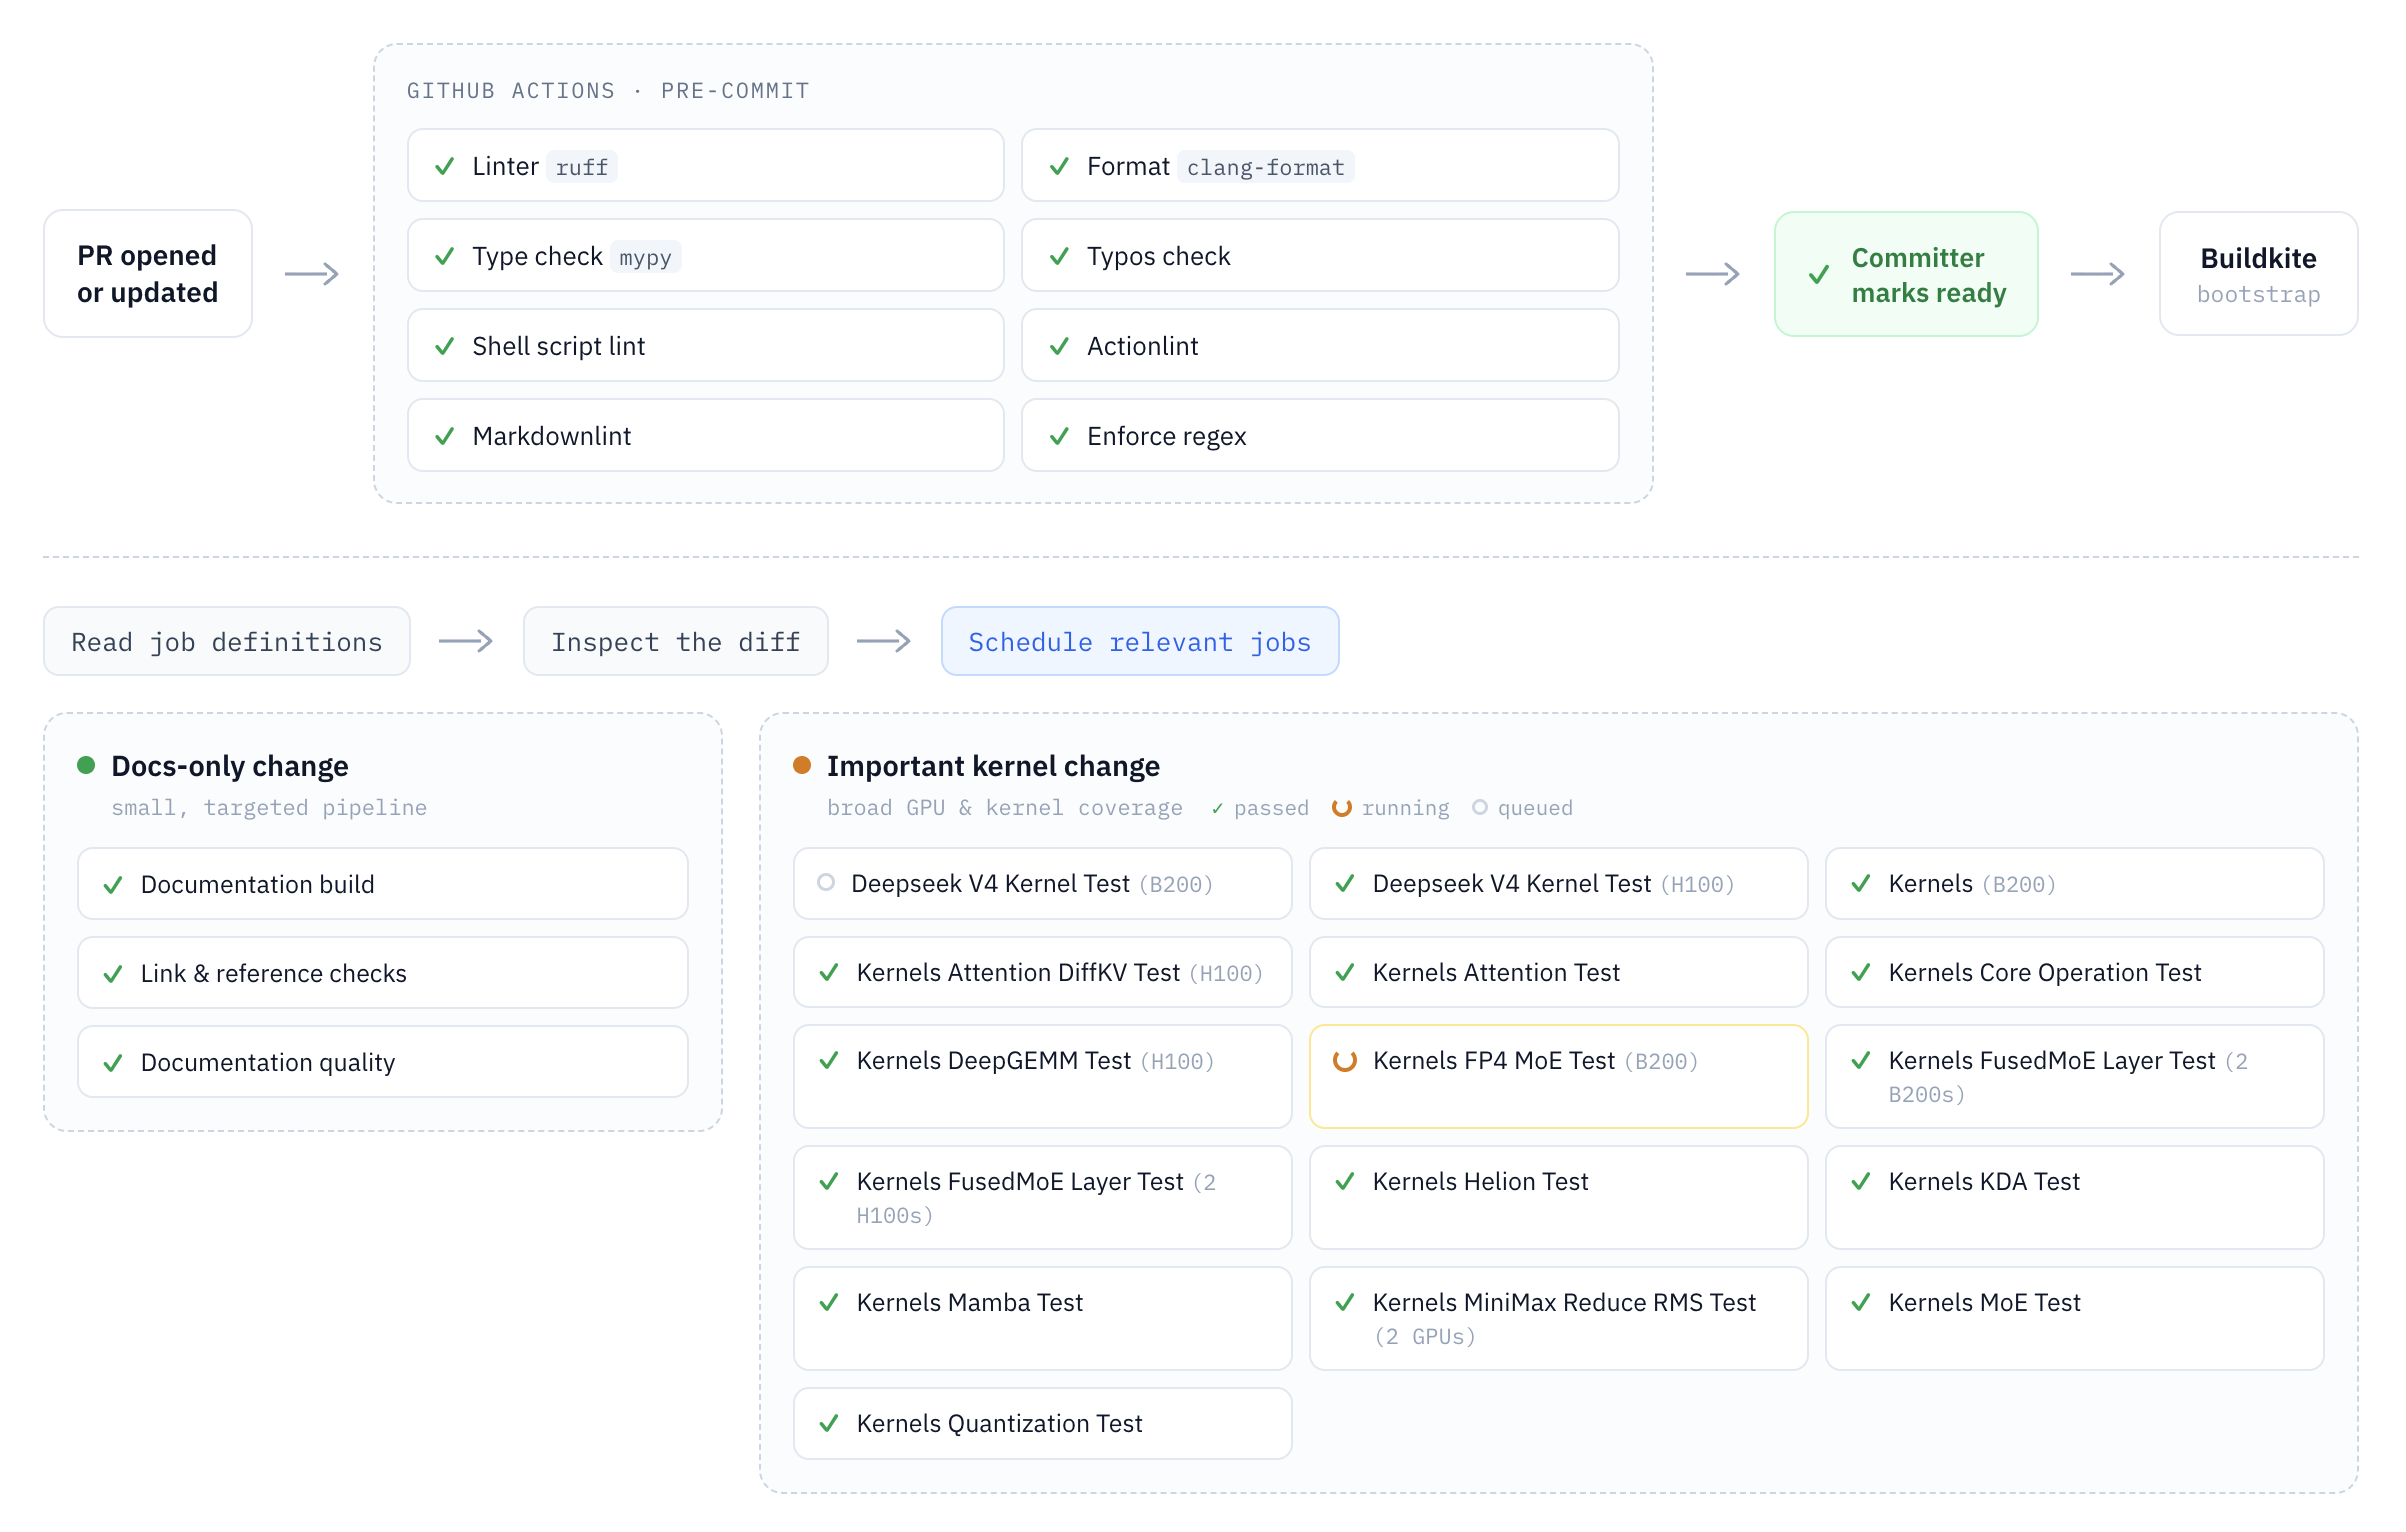
Buildkite assembles each PR’s testing pipeline dynamically: a bootstrap step reads the job definitions, inspects the diff, and schedules only the relevant groups. Change only documentation and you may get a handful of jobs. Touch a few important kernels? Buckle up for 100+ jobs launching in parallel.
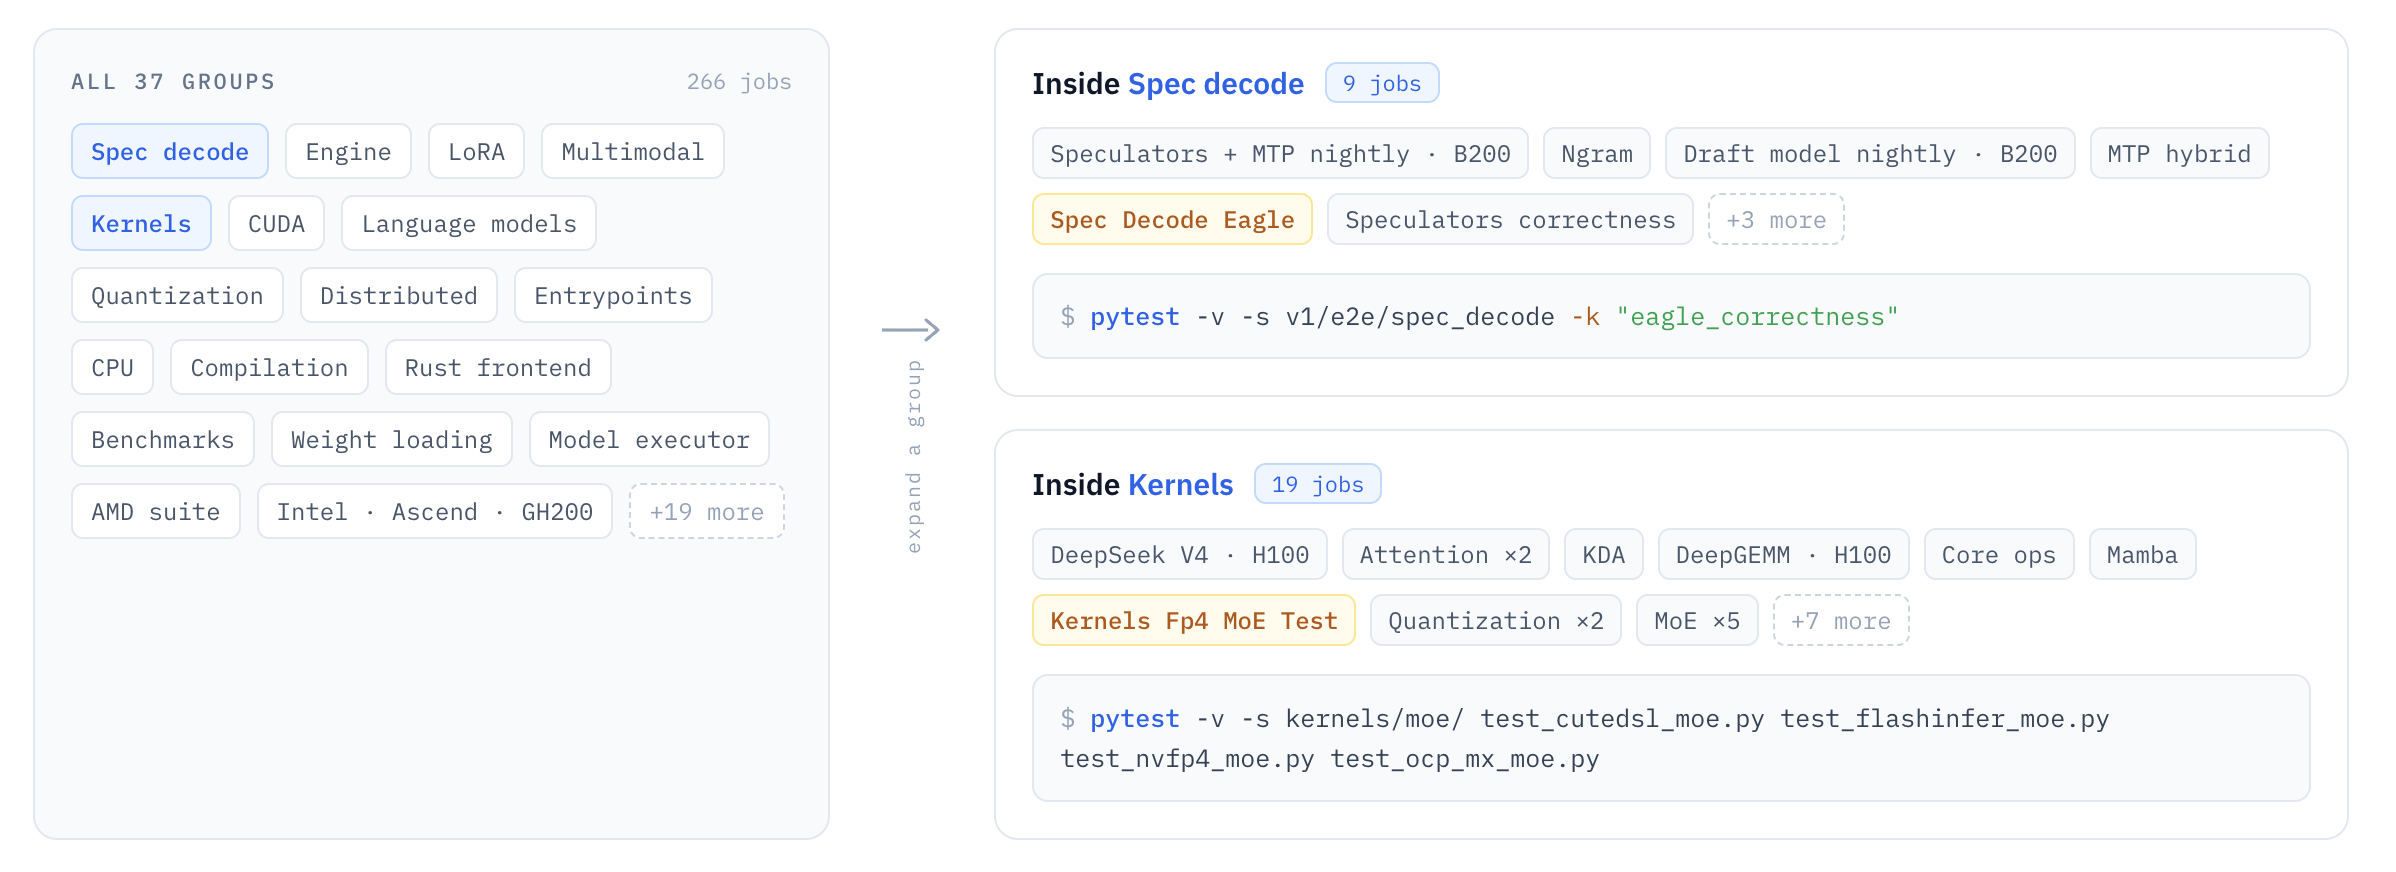
In total, the vLLM CI suite runs 37 test groups and 266 jobs, covering every major component and feature—from different kernels to speculative decoding to LoRA. Groups range from a couple of jobs to a few dozen, and many tests exercise several components at once. Here is a subset:
Ensuring test environment is consistent
A test only means something if it runs the same way every time. We usually see two kinds of drift get in the way: the environment can differ across our CI runners, and dependencies can change under us over time. A shared container image removes the first; a pinned dependency graph removes the second.
Same container image, every machine. With 266 jobs fanning out across dozens of machine types, the fastest way to a flaky, untrustworthy result is to let each job set up its own slightly different environment. To avoid this, the majority of our jobs run inside the same container image, built once at the start of a run and reused everywhere. Our Dockerfile builds in stages, each adding to the one below it.
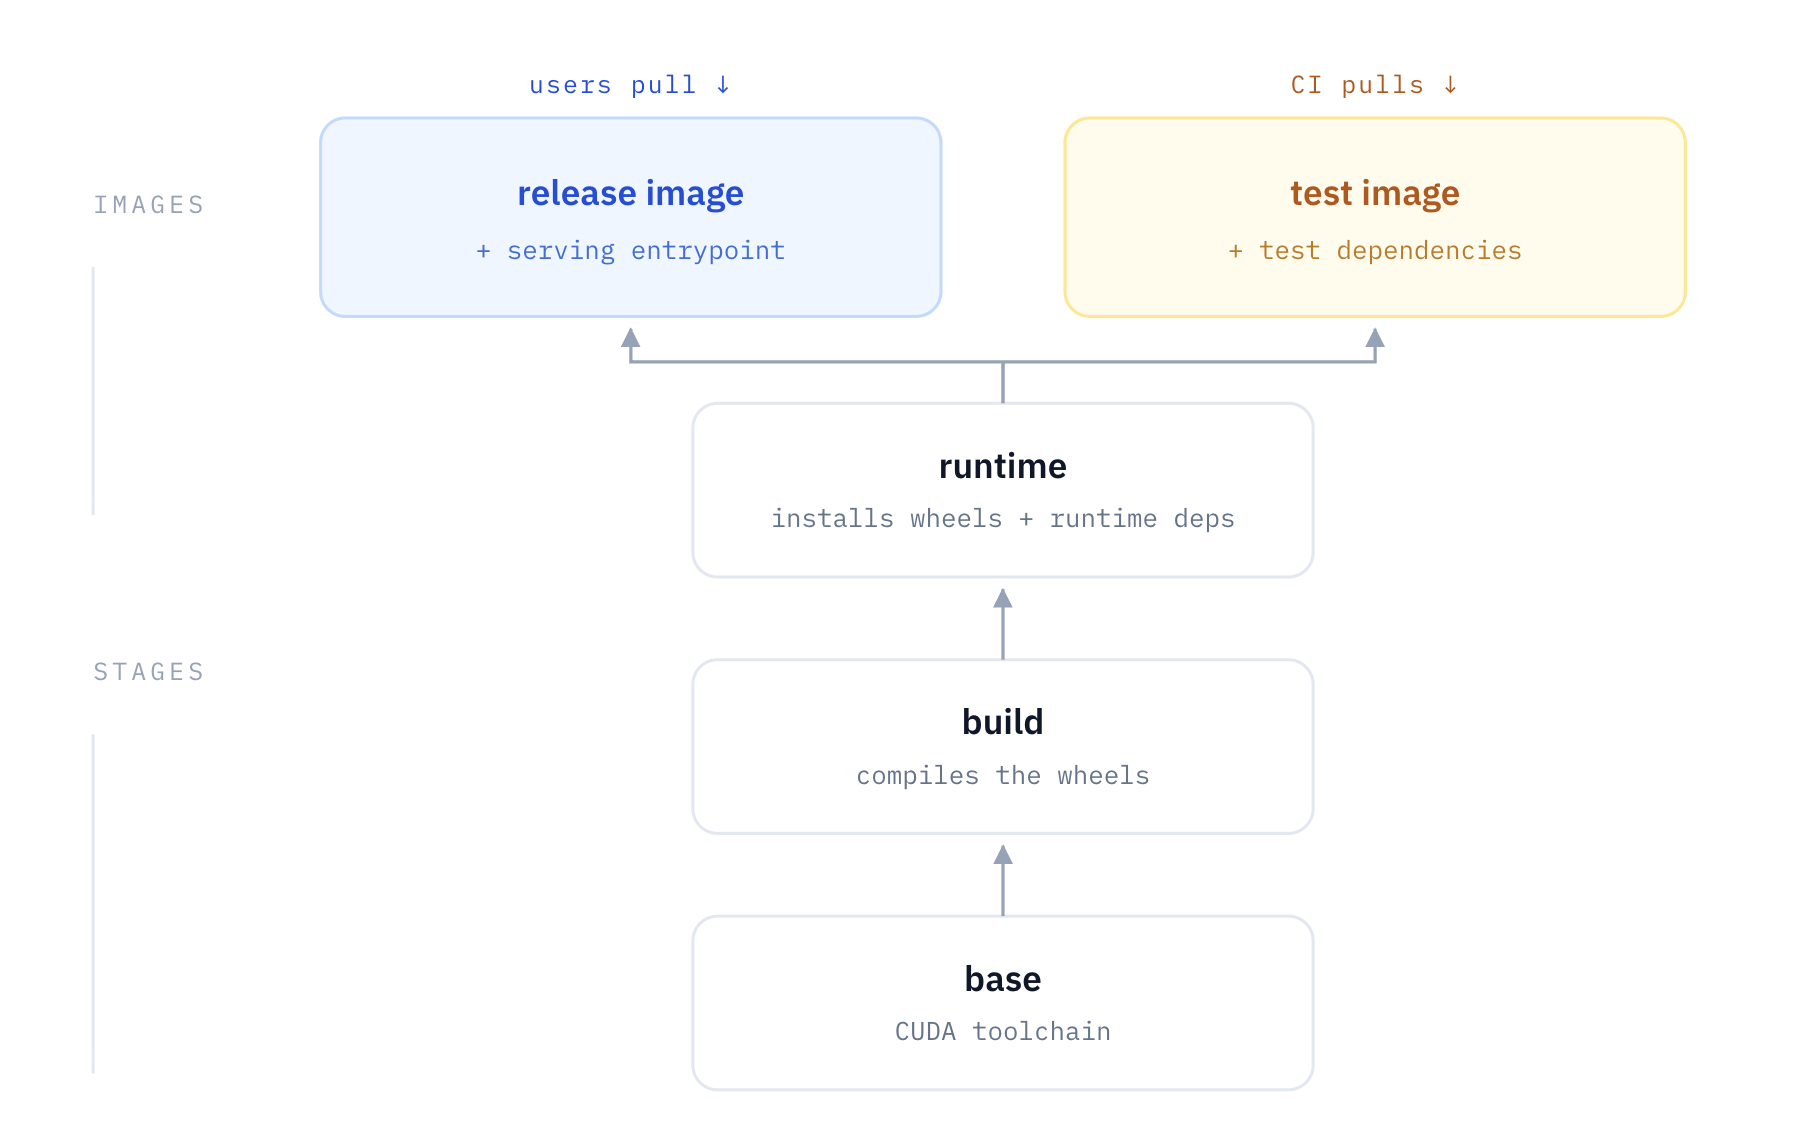
A base stage provides the CUDA toolchain; a build stage compiles the wheels on top of it; and a runtime stage installs those wheels with their runtime dependencies.
From there, the build forks: one image adds the serving entrypoint and becomes the release image, while a separate test image adds the test dependencies and becomes the image CI jobs pull. That shared ancestry keeps what we test close to what we ship.
For jobs using that shared image, a kernel test on a B200 and an entrypoints test on an L4 pull the same container image, byte for byte, while running on different hardware. Building it once removes a major source of variation: failures are much less likely to come from per-job setup drift.
Same versions, every run. Dependencies drift over time—and that's the half we learned the hard way.
An unpinned dependency makes failures tricky to chase down: the same test passes on Monday and crashes on Wednesday. You read every code change in between; none of it looks related. Hours later, it clicks—FlashInfer shipped a new version on Wednesday, and the build quietly picked it up. And FlashInfer was never alone: nixl, transformers, and their transitive dependencies bit us the same way—each unannounced upgrade a fresh chance to break CI, with the cause buried a dependency layer down.
So vLLM CI locks its dependencies. We run the top-level dependencies through pip-compile to generate lock files that pin every package, including transitive dependencies.
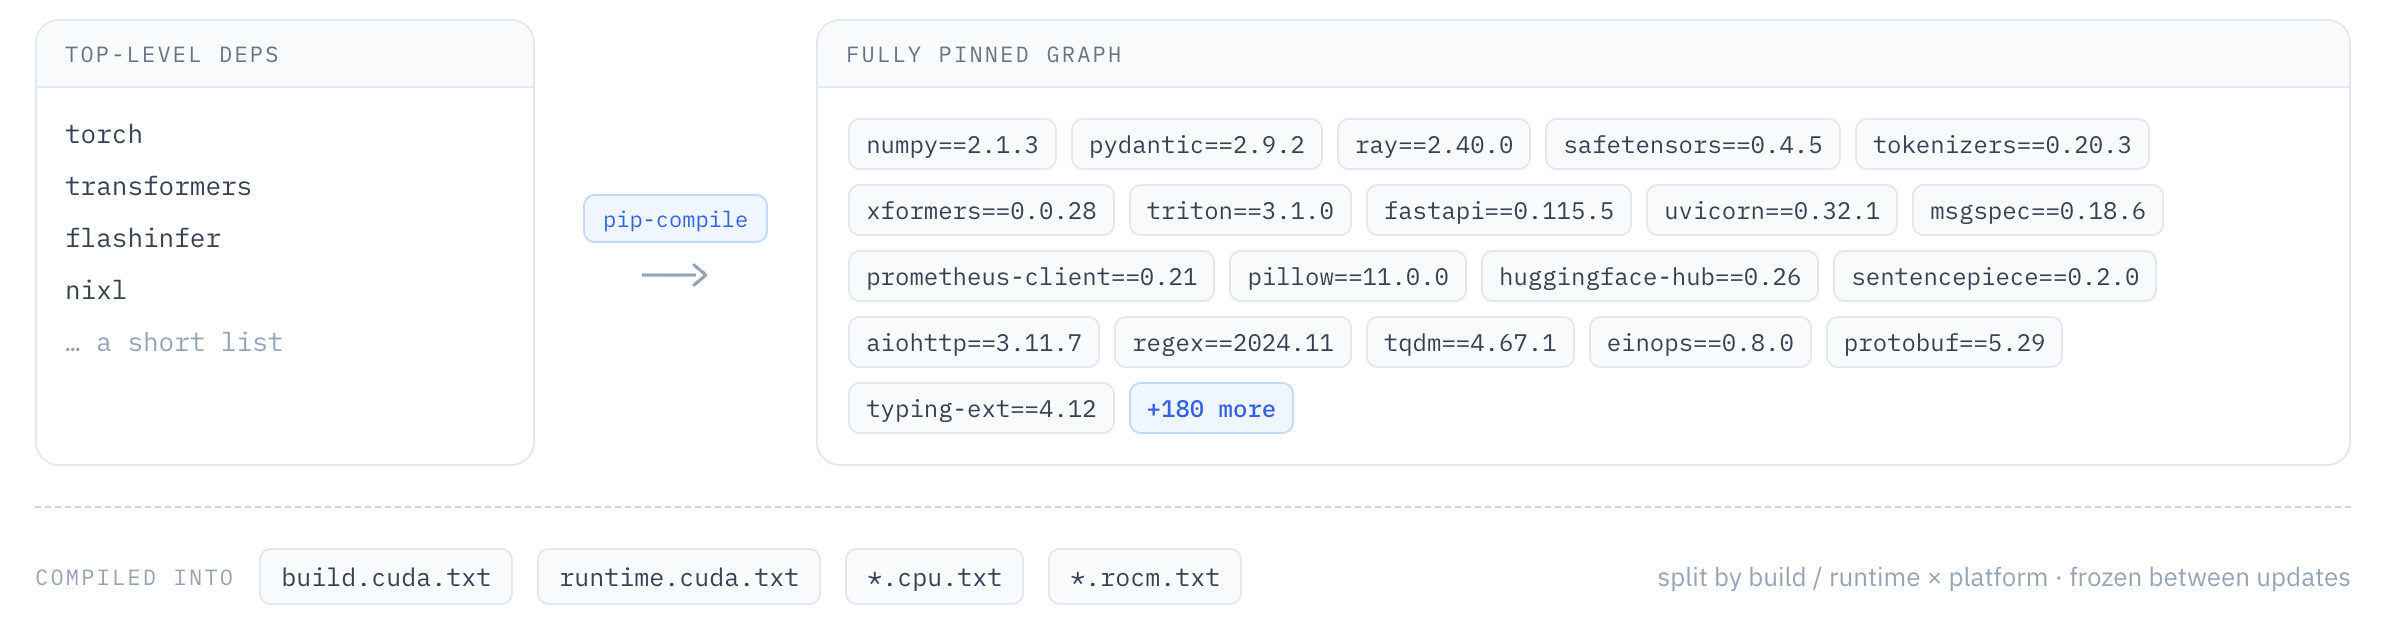
We update the locks periodically and run the full CI suite each time. Since we started pinning the full graph, dependency-caused breakages are no longer a recurring headache.
Scaling CI compute across a heterogeneous, multi-provider fleet
Each job gets pushed to a runner queue on Buildkite — a pool of machines with a particular hardware profile. For example, the gpu_1 queue is backed by individual VMs with L4 GPU; the b200 queue is backed by a Kubernetes cluster with B200s inside. When a runner becomes available, it claims the next job in the queue, runs it, and reports the result back to Buildkite.
vLLM CI, at the time of writing, has 58 runner queues spanning a wide range of accelerators, and that hardware is provided by multiple partner organizations.
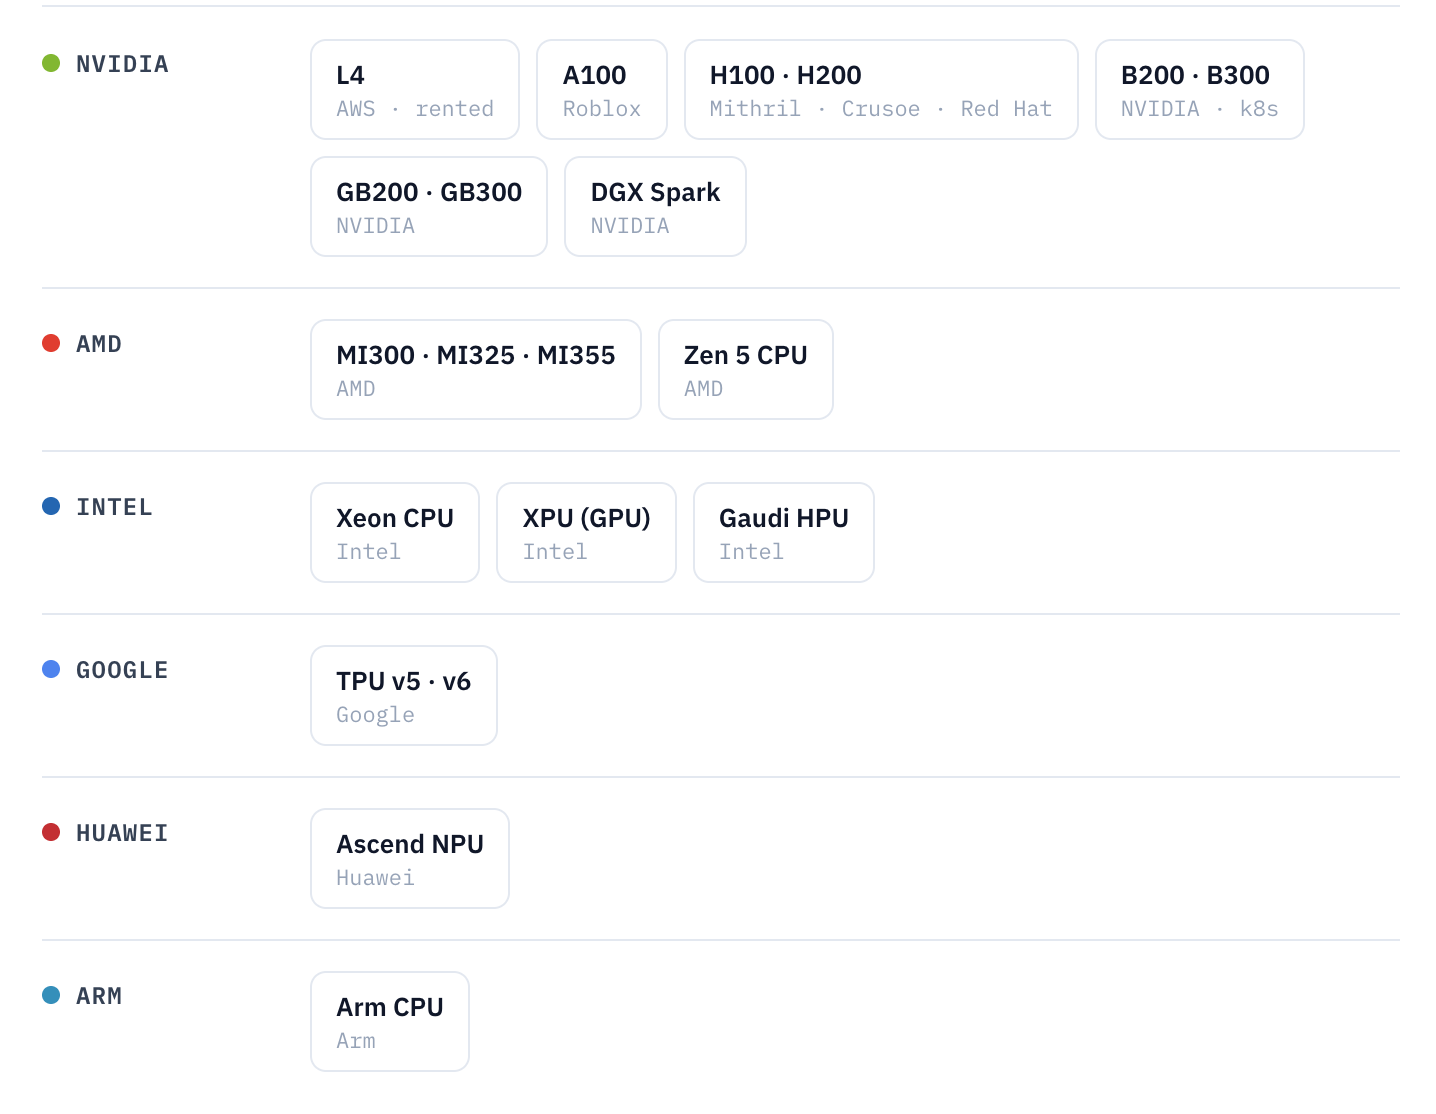
There’s a limit on how much we can spend on compute. Even if we can afford it, managing all of these machines ourselves is a pretty tough job. CI coverage with this much diversity is only possible because of the generous support and collaboration from many of our amazing partners.
However, integration is a big challenge. Every partner has different requirements: some simply hand us access to everything, some prefer to manage their own hardware, some have very tight security guardrails.
So how do we manage to plug them all into one CI pipeline?
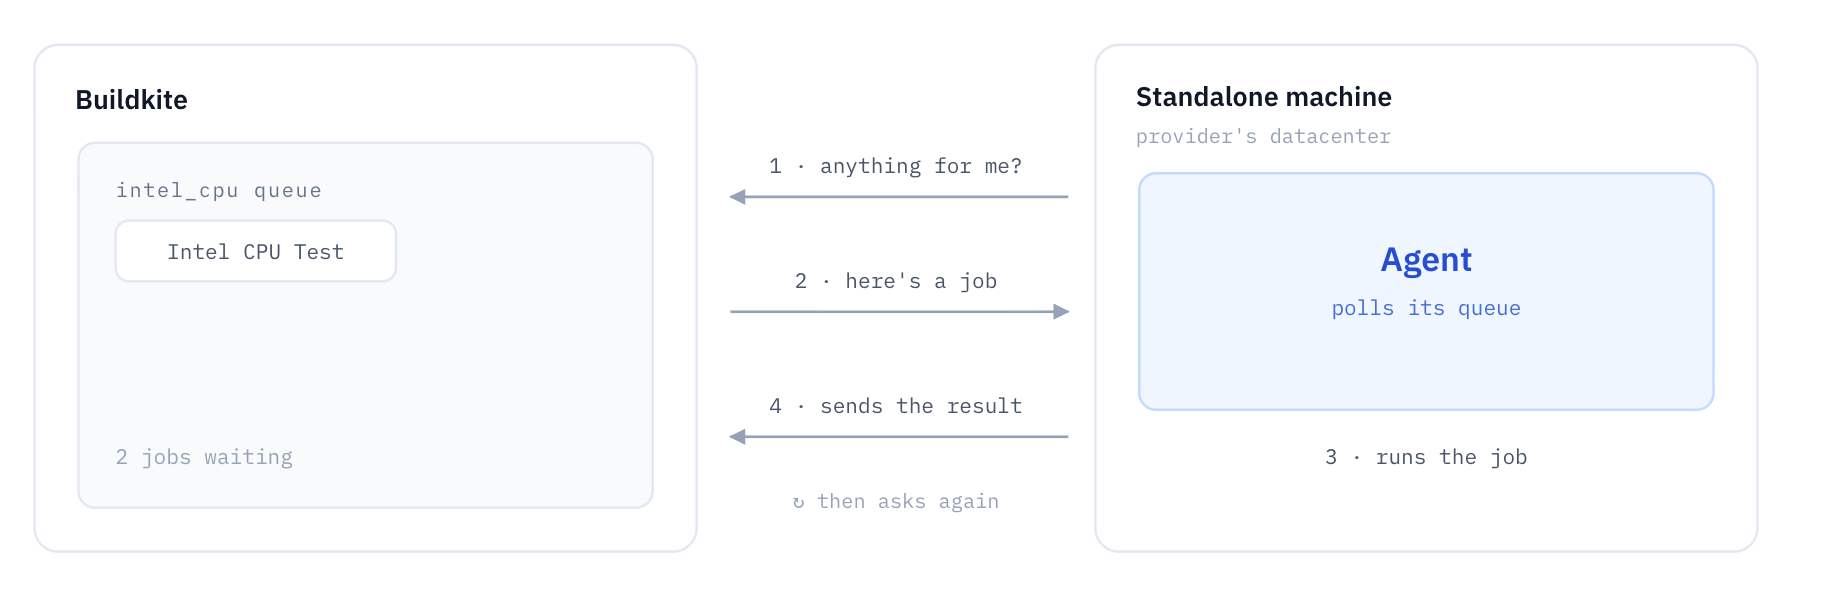
This is where Buildkite agent comes in. It runs inside the provider’s environment and connects outbound to Buildkite over HTTPS to receive work. Because Buildkite does not need to initiate connections to the agent, providers do not have to expose inbound ports, configure a VPN, or give us access to their network.
When the agent accepts a job, it runs the command, streams the logs back, and reports the final exit status. A persistent agent then waits for more work, while an ephemeral agent exits after completing its job.
There's more than one way to run that agent, and providers pick whatever fits their setup.
The simplest is a standalone machine — our 8xA100 machine or Arm server. The provider installs the agent, points it at a runner queue, and it runs that loop forever.
For machines in a Kubernetes cluster, the same model works through the Buildkite Agent Stack for Kubernetes. The controller turns each matching job into a Kubernetes Job with a single Pod, which runs the test and reports back. We always recommend this way because it’s very scalable: you don’t need to install Buildkite agents on every single node, just add them into the cluster.
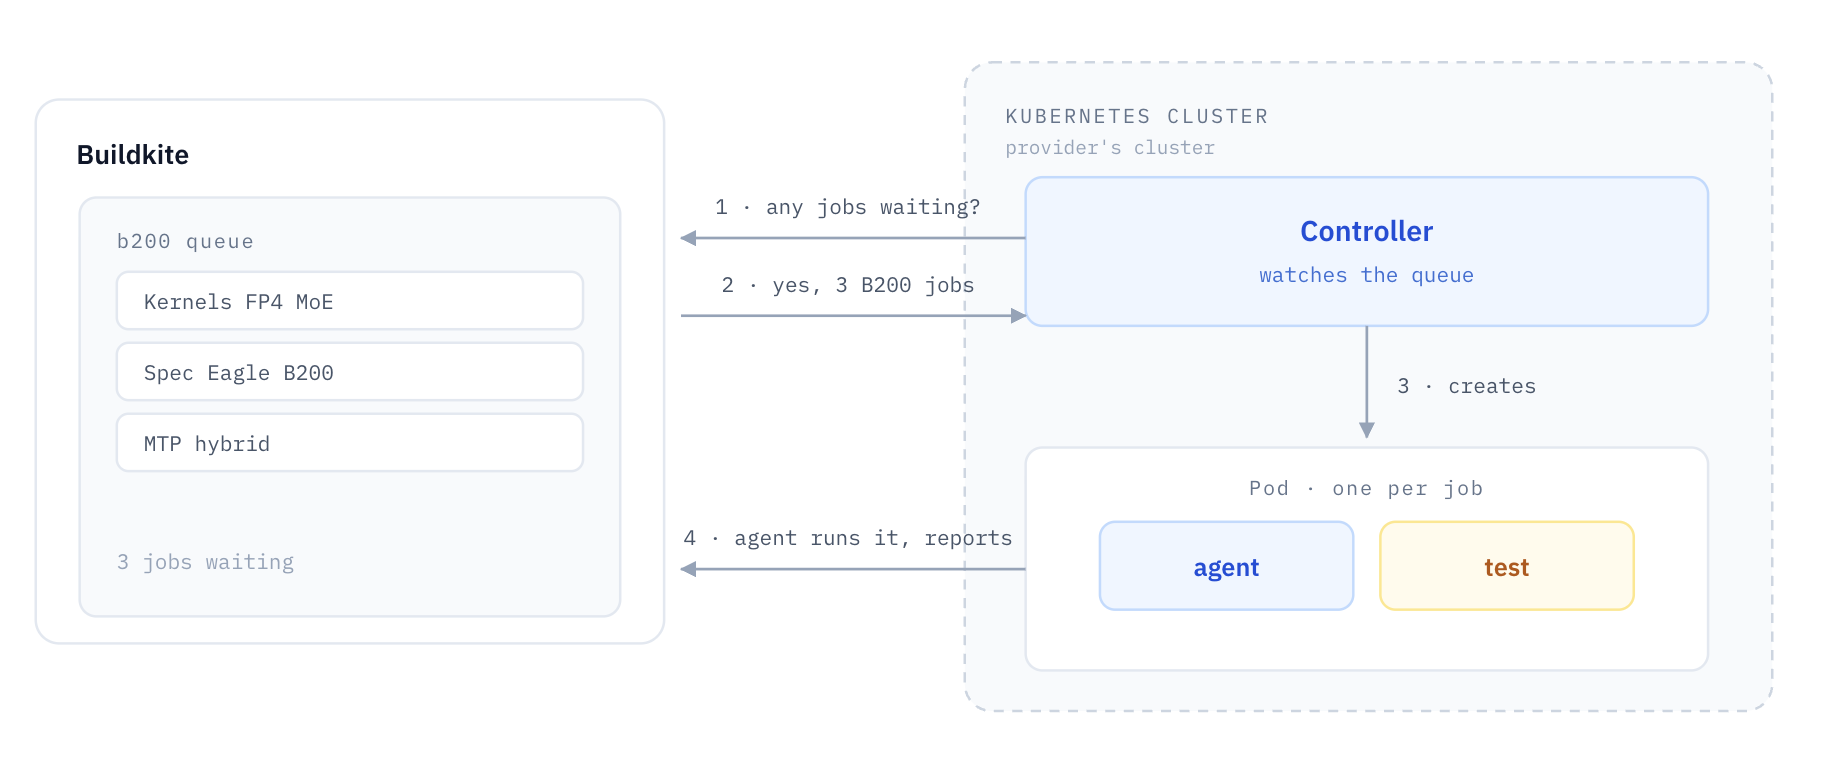
Either way, onboarding is simple on our end: we create a queue, provide a token, and the provider starts the agent themselves. We don’t need access to the machine. That's what lets vLLM test on more hardware than we could ever afford to own—a donated fleet worth millions of dollars a year.
Utilizing hardware is challenging
There’s a lot of demand and a hard limit on compute, so we need to make sure none of it goes to waste.
MIG-slice the big GPUs
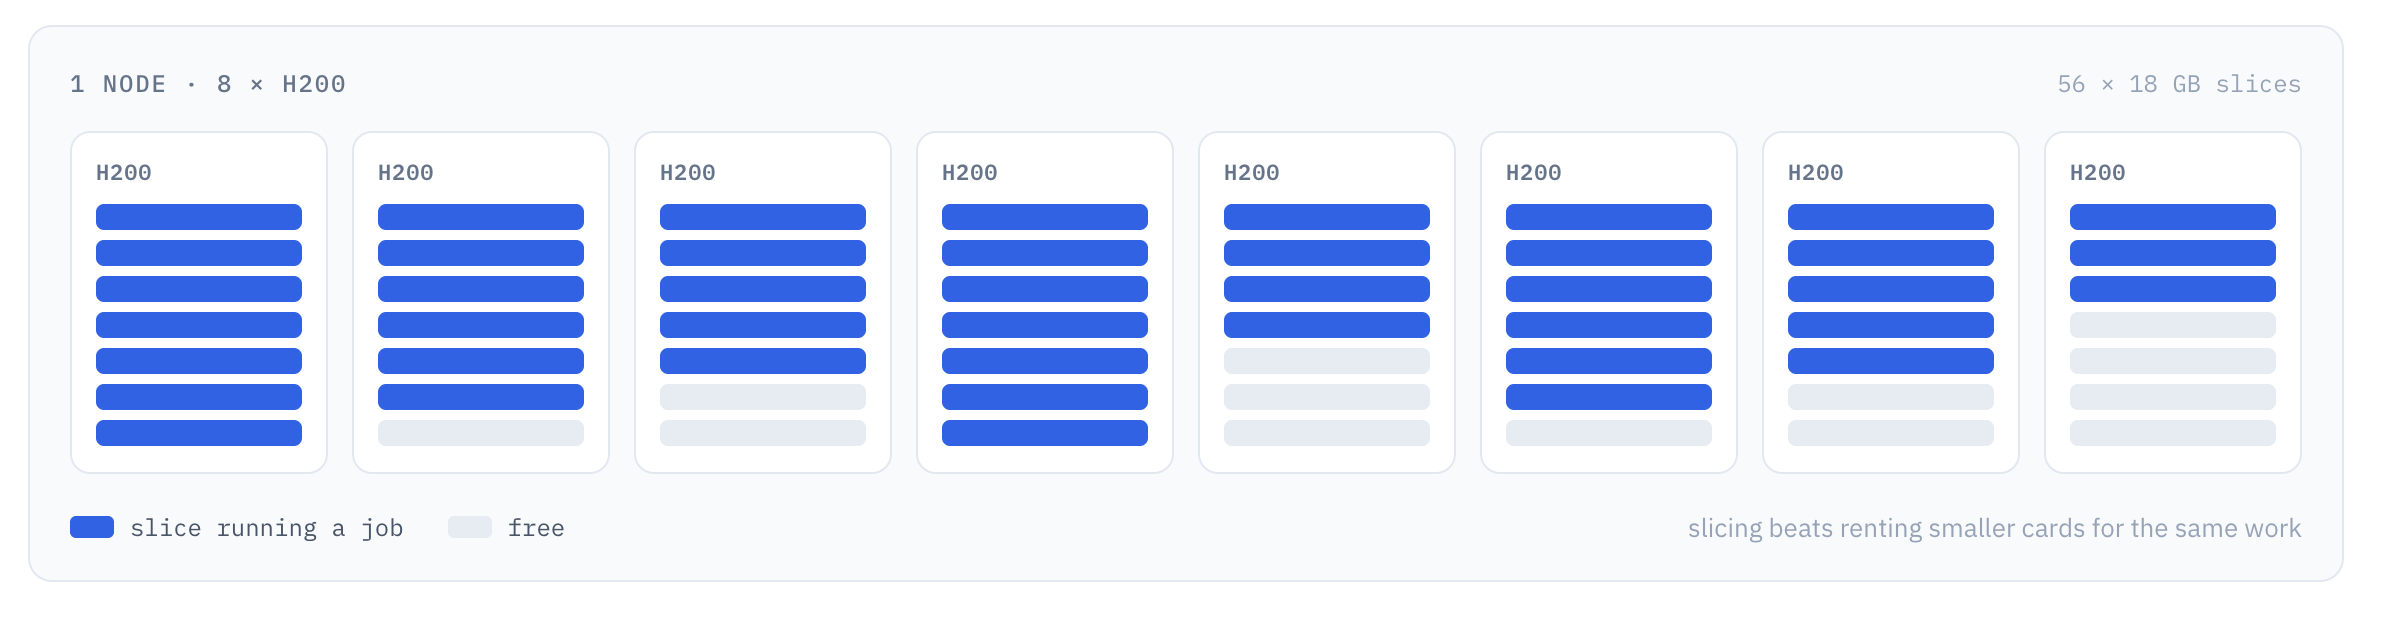
Most CI jobs run with smaller models and need far less than a whole GPU. NVIDIA's Multi-Instance GPU (MIG) lets us carve one card into several isolated slices — an H200 becomes seven 18 GB partitions — meaning 7 jobs can share one GPU at a time. We did some math here and realized that in many cases, slicing a big GPU is a lot cheaper than renting smaller GPUs for the same amount of workload!
Autoscale from zero, one job per machine
For the machines we rent by the hour, leaving them on and idle just wastes money. So each of those queues scales itself: when jobs are waiting, it starts more machines; when there's nothing to run, it goes down to zero. Each machine picks up one job, runs it in a container, and shuts down. As a bonus, it also keeps tests clean: every job gets a fresh machine, so nothing left over from a past run can mess with it.
Don't rebuild what you can reuse
The slowest, most repetitive, and most expensive parts of CI are:
-
Building the standard Docker image used by whole CI pipeline
-
Compiling CUDA kernels
-
Installing all dependencies
-
-
Downloading model weights from Hugging Face.
so we try not to:
-
Docker layers: we apply registry caching and reuse cached layers instead of rebuilding. This would include the dependencies.
-
Warm-cache AMI for builder: we have a nightly job to build the AMI used for our builder machines with the latest layers already pulled, so our builder machine starts as close to main as possible.
-
Compiler cache: we leverage sccache so that compiled C++/CUDA outputs are cached in an S3 bucket and reused across builds. Every builder machine can read from this bucket, but only builder machines used for the main branch can write to it.
-
Model weights: the models we test are huge, so for each of the clusters, we download them once to shared storage and every job reads from there, instead of pulling gigabytes each time.
Making CI health visible
With hundreds of CI runs a day, each running hundreds of jobs across different hardware, we also need to know whether the system itself is healthy.
A queue quietly backs up to hours of wait time. A test starts to flake one run in twenty. The job runs 10 minutes slower than last month. It’s not easy to track that.
We took inspiration from the incredible PyTorch CI HUD (hud.pytorch.org), built by our good friends at PyTorch, and created one of our own at ci.vllm.ai.
Every 15 minutes, data from our Buildkite pipelines is ingested into Databricks and ClickHouse.
With all the available data and full control of the dashboard, we have so much flexibility on building out our observability stack. It gives us an easier time answering these typical questions:
Question
Is main branch healthy right now?
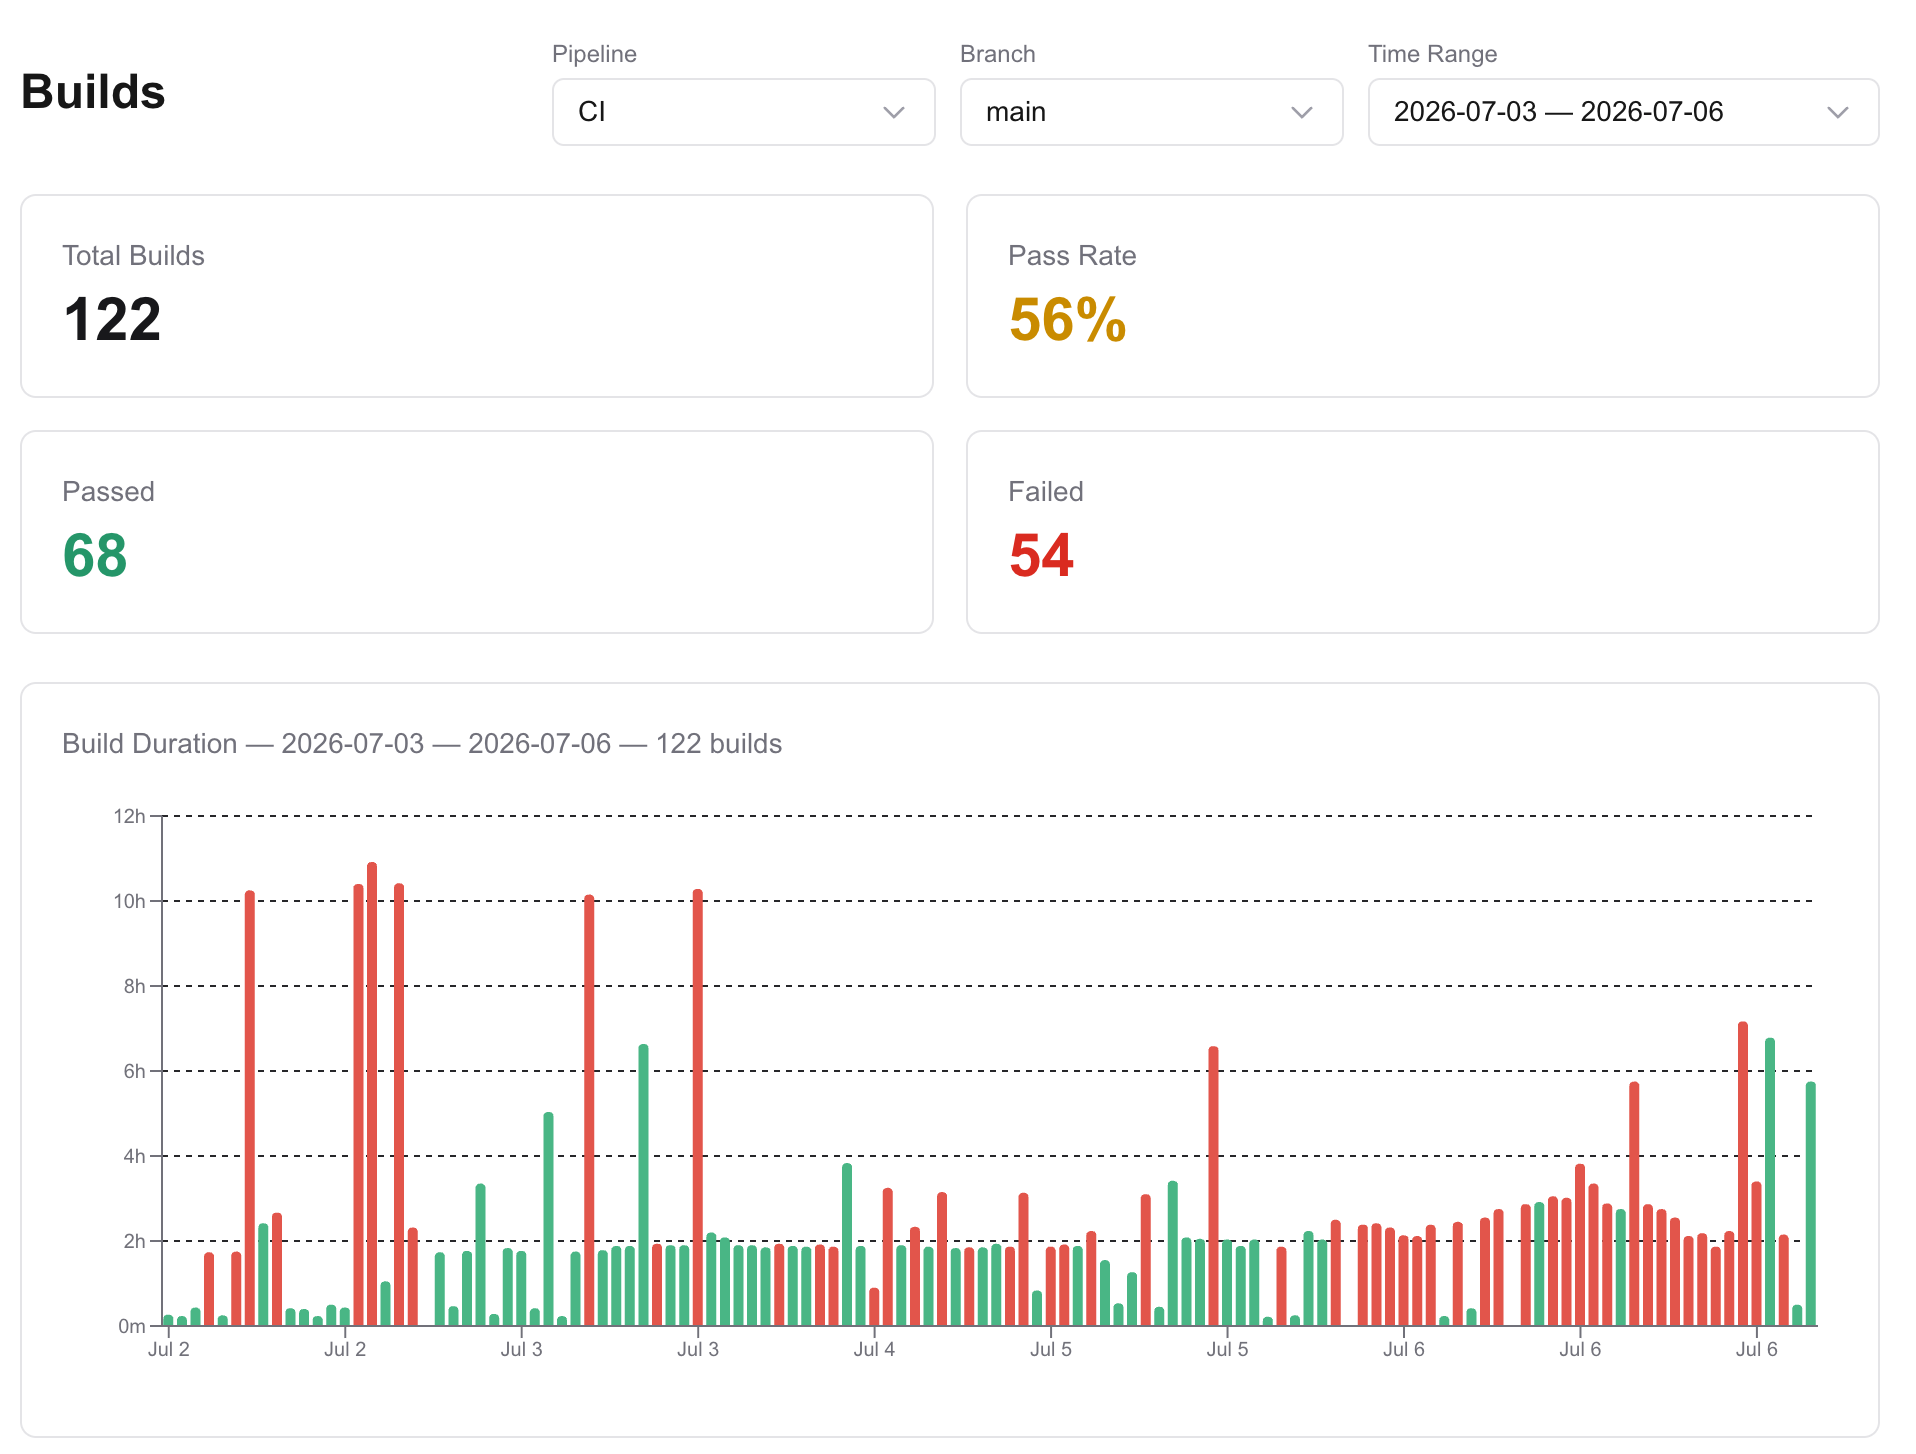
What the dashboard tells us
For the past 3 days, no. And why did jobs take 10 hours!?
Those are just a few examples of what our dashboard can do. Modern coding agents have made this kind of tooling surprisingly approachable, even without deep front-end expertise.
Automating failure detection and response
The dashboard helps us see problems. The next step is shortening the time from detection to diagnosis, and of course we have to leverage the powerful AI agents here.
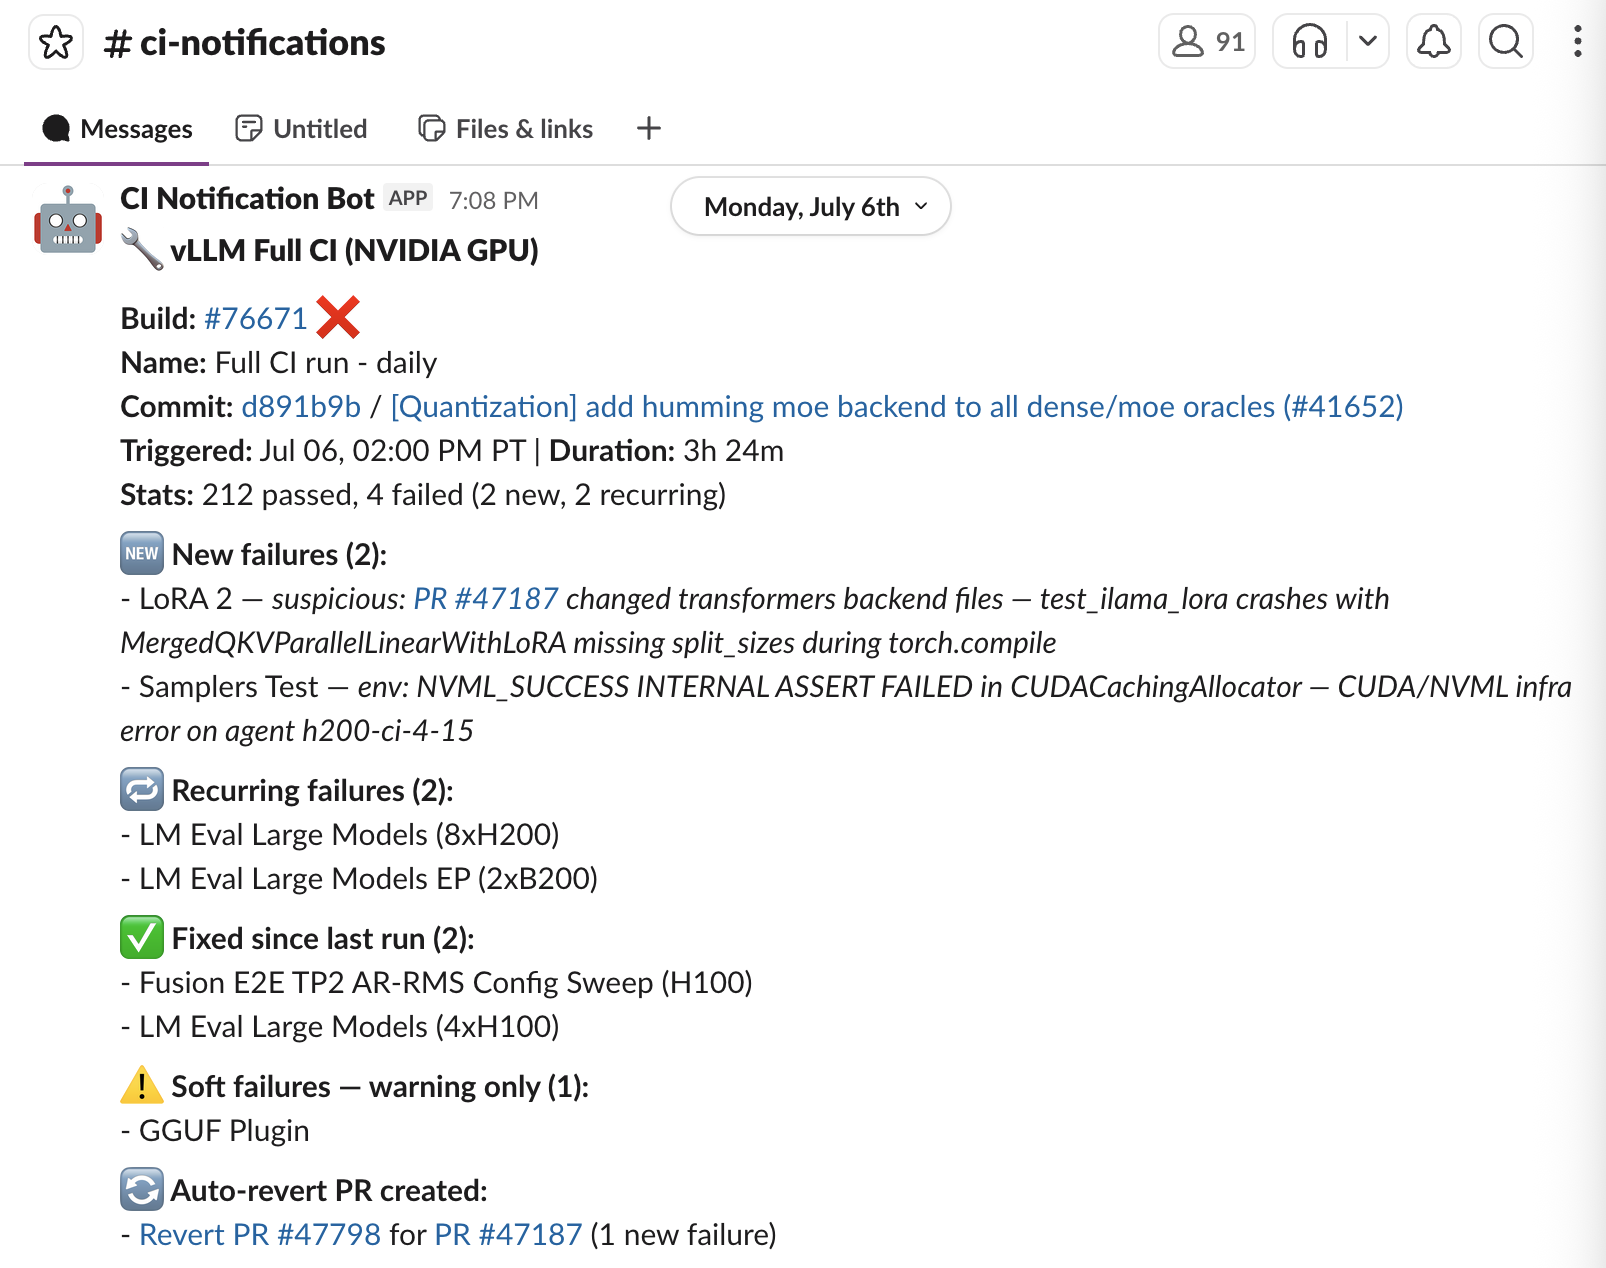
Every night, a CI-analyzer bot runs the full suite and compares the results with the previous night's run. If something newly failed, it reads the error logs, classifies the failure, and walks the intervening commits to find the culprit. It then posts a report to Slack with an auto-revert PR ready for maintainers to review and merge. That's about 1.5 auto-revert PRs a day, with the right failure and culprit commit identified around 70% of the time—so the on-call reviewer usually starts from a correct diagnosis instead of a blank page.
The bot has become essential to catching breakages fast, alongside the community effort to fix issues as they land—shout-out to everyone that helps, especially the on-call rotation at Red Hat!
What a green check cannot tell us
Put together, all of this is what lets us trust a green check on a PR: broad unit test coverage, run across a huge fleet of different accelerators, in consistent environments, and well-monitored. When CI passes, we're confident merge risk is significantly reduced.
But CI doesn’t tell the whole story. A change can pass every test and still make a model slower or its output incorrect. To keep CI fast and affordable, we tend to skip a lot of e2e tests and, more importantly, not closely simulate what vLLM users go through every day. That's what the next layer is for.
Layer 2: Performance benchmarking & accuracy evaluation
In May, we shipped v0.20.0 and within days had to cut two emergency patches, v0.20.1 and v0.20.2. Two problems had slipped through: one broke gpt-oss on Blackwell when split across multiple GPUs (tensor parallelism > 1), the other tanked DeepSeek V4 throughput on GB200.
At the time we had no benchmarking pipeline; nothing ran these models end to end on that hardware to confirm they still worked and ran fast before we shipped. So both problems sailed past CI and reached users.
Performance regressions rarely crash. The server starts and requests succeed; users simply get fewer tokens per second or wait longer for the first token. Accuracy regressions are quiet: the model returns a valid response, but the answer is wrong.
We realized how important it is to run models end to end, with performance benchmarks and accuracy checks, so we invested a lot of time building this layer.
It now provides a lot of signals for our release process and has already caught several major regressions. We built the system that would’ve caught the problems on v0.20.0 before it was shipped.
Running a matrix of models and accelerators every night
We maintain our pipeline at https://github.com/vllm-project/perf-eval. Each config file describes a workload: how to start vLLM server, which arguments to use, which model to serve, which accelerator, and which tasks to run.
Each workload generally runs three tasks:
-
Performance benchmark — measuring time-to-first-token (TTFT), time-per-output-token (TPOT), and many other metrics — using
vllm-bench -
Model accuracy on math and reasoning benchmarks (GSM8K, GPQA, AIME) using
lm-eval -
Function-calling accuracy via the Berkeley Function-Calling Leaderboard (BFCL)
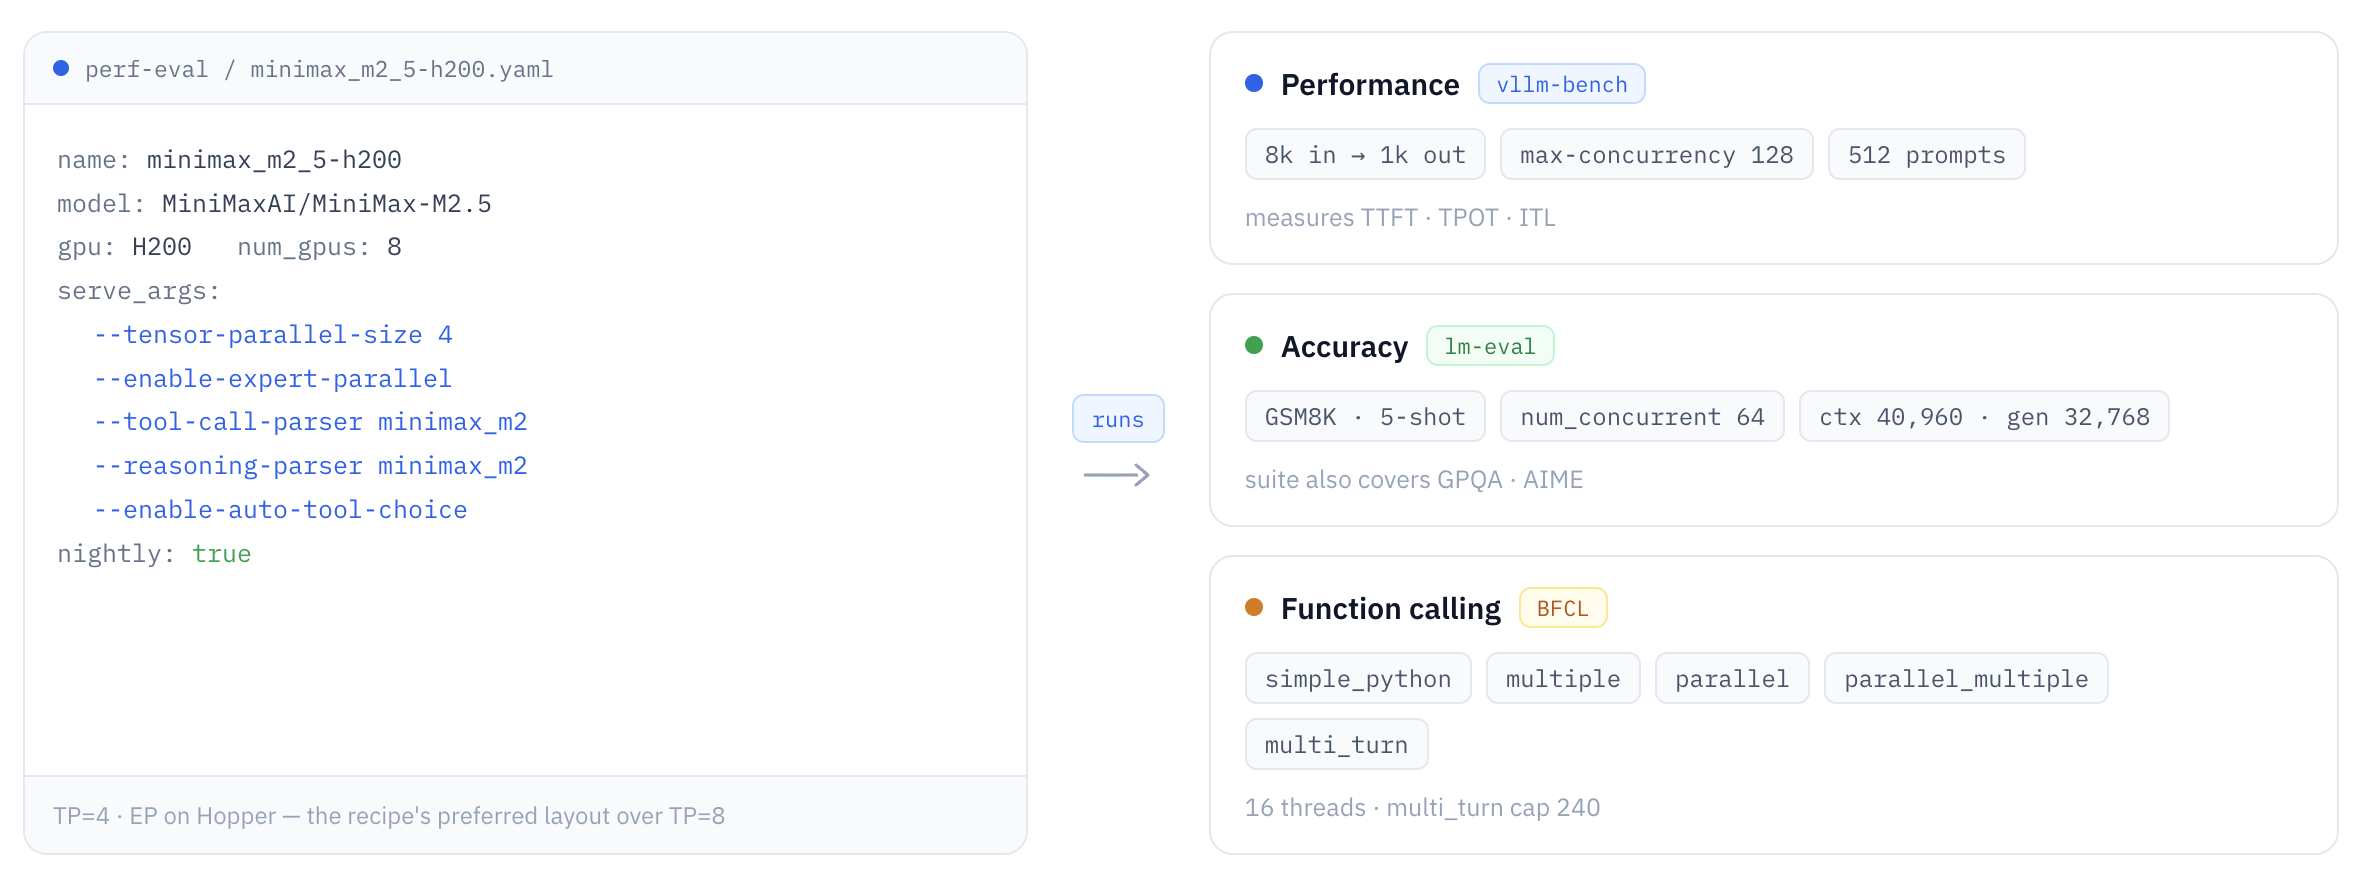
Every night, and for every release candidate, we run the full suite across selected models — DeepSeek V4 Pro/Flash, gpt-oss, Kimi K2.5, MiniMax M2.5 and M3, Qwen3.5, GLM 5.1, Gemma 4, and Nemotron 3 Super — on H200, B200, MI300X, and MI355X. That's 17 model-hardware recipes in total right now, and the list keeps growing. We plan to add support for GB200/GB300, PD disaggregation, and more models very soon.
Is it always fast?
After every run, the results are ingested into our database. Remember the CI dashboard from earlier? It has perf results too!
We turn the nightly numbers into charts that make regressions easy to spot over time.
For example, this is a view of our Performance dashboard:
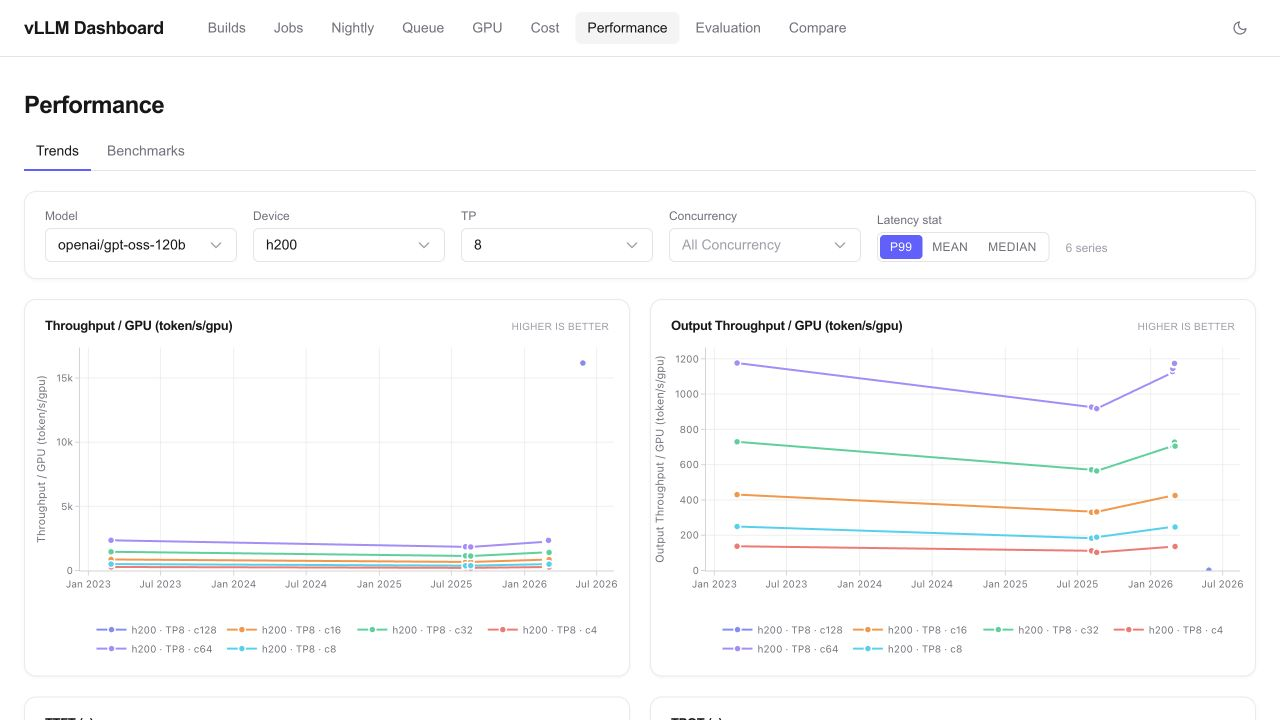
Performance history for gpt-oss 120B on H200 with tensor parallelism 8, split by concurrency.
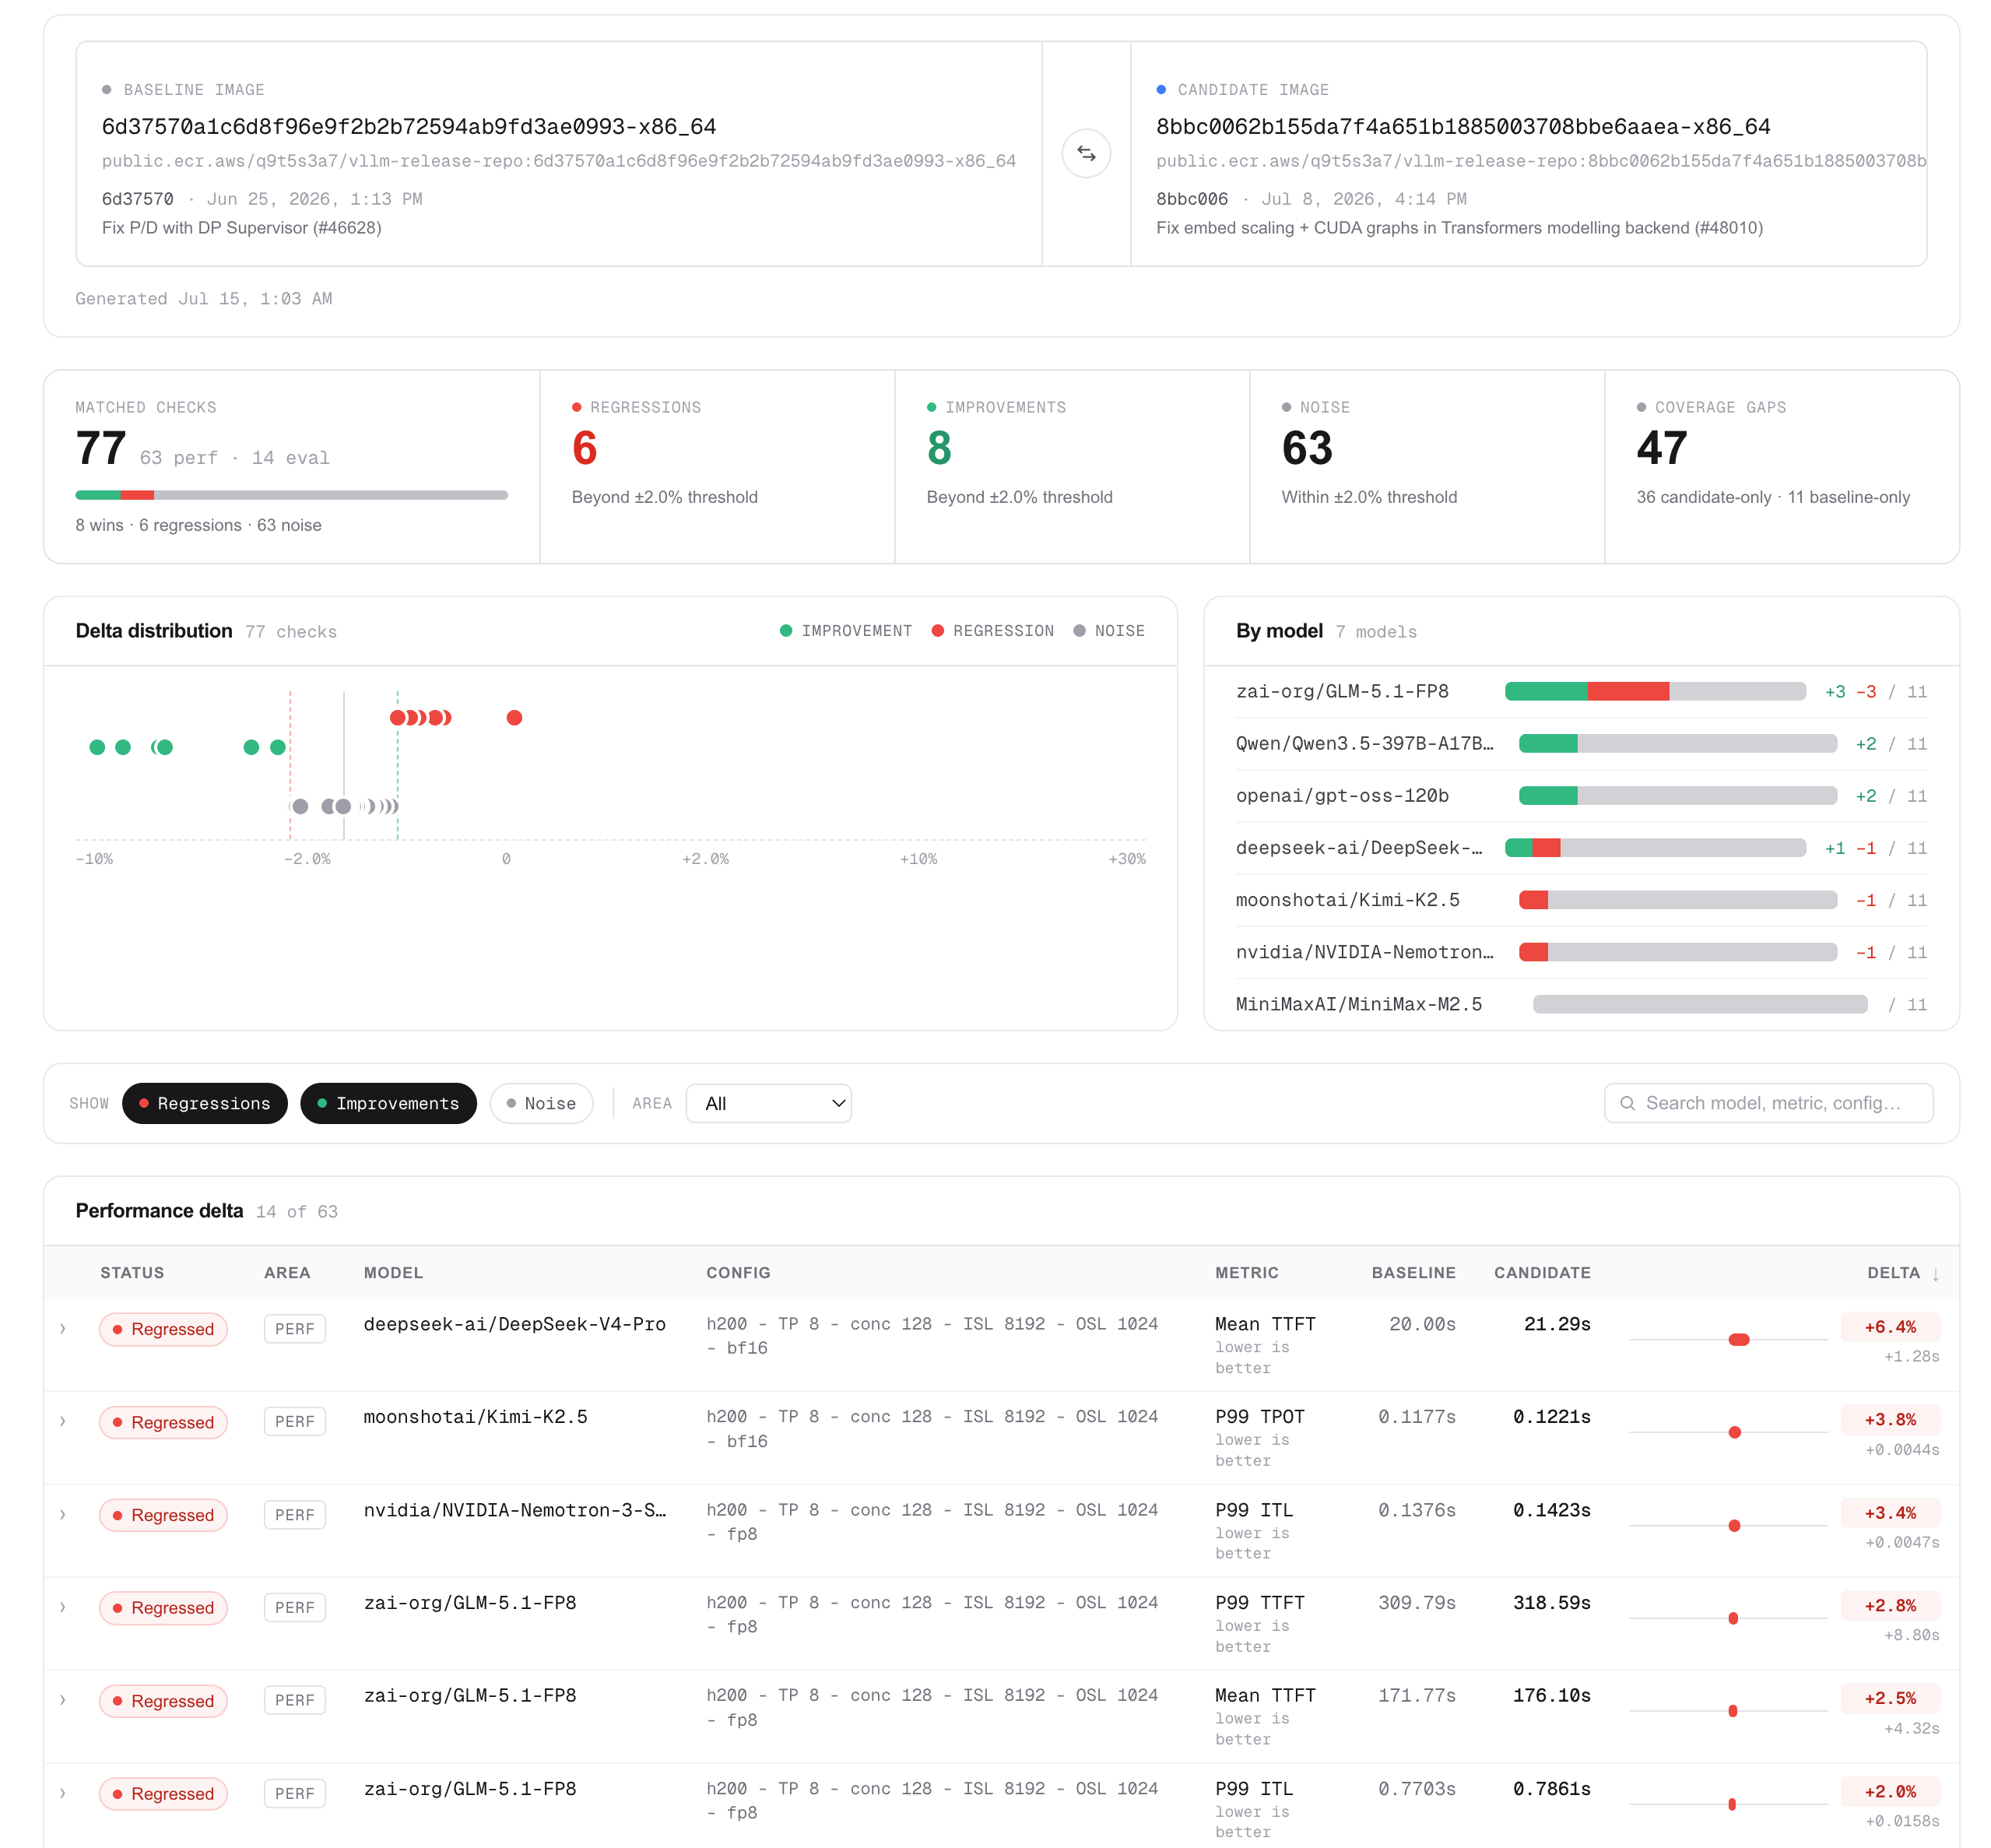
The Compare view lets us compare two vLLM images head-to-head — say, a release candidate against the last release.
Is it always correct?
If your vLLM instance is blazing fast but its output is garbage, that speed is worthless. Beyond performance, we make sure the model's answers still hold up.
The Evaluation dashboard stores aggregate scores and error bars, then lets us open a run and inspect the underlying question, reference answer, raw response, extracted answer, and correctness result. That sample-level evidence is far more useful than debugging from a single aggregate number.
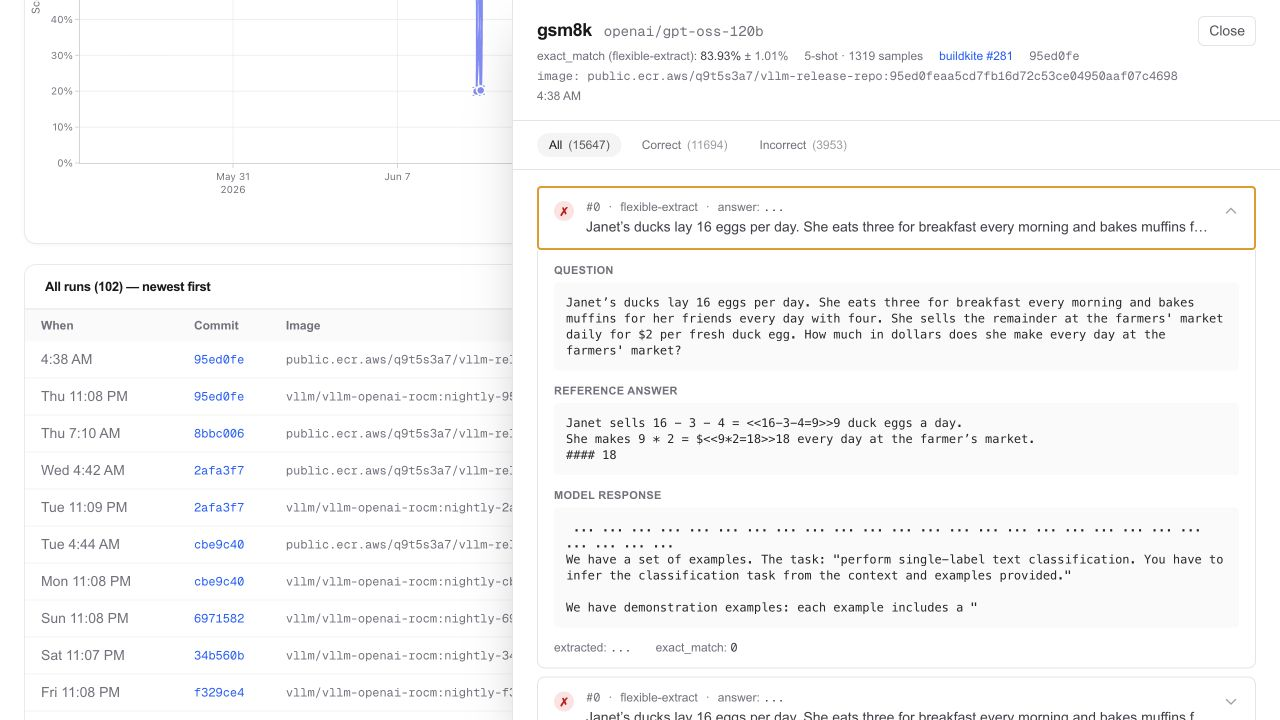
An incorrect GSM8K sample exposes the exact question, expected answer, model response, and extraction result.
Layer 3: Release process
Shipping on a fast cadence
Since November 2025, we have been maintaining a two-week cadence on vLLM releases. Many projects of our size take a lot longer to ship. Why we keep this cadence:
-
Changes reach users fast. A new release is never far behind main.
-
It’s predictable. Users and downstream projects can plan around a steady schedule instead of guessing when the next release lands.
-
Managing features and tracing regressions are easier when there are 500 commits to bisect rather than a few thousand.
-
Less deadline pressure. Contributors no longer feel the need to rush their changes in before the train departs. They just catch the next one in two weeks.
-
Cherry-picks stay clean. A fix from just days ago is usually a simple pick, not a merge-conflict mess.
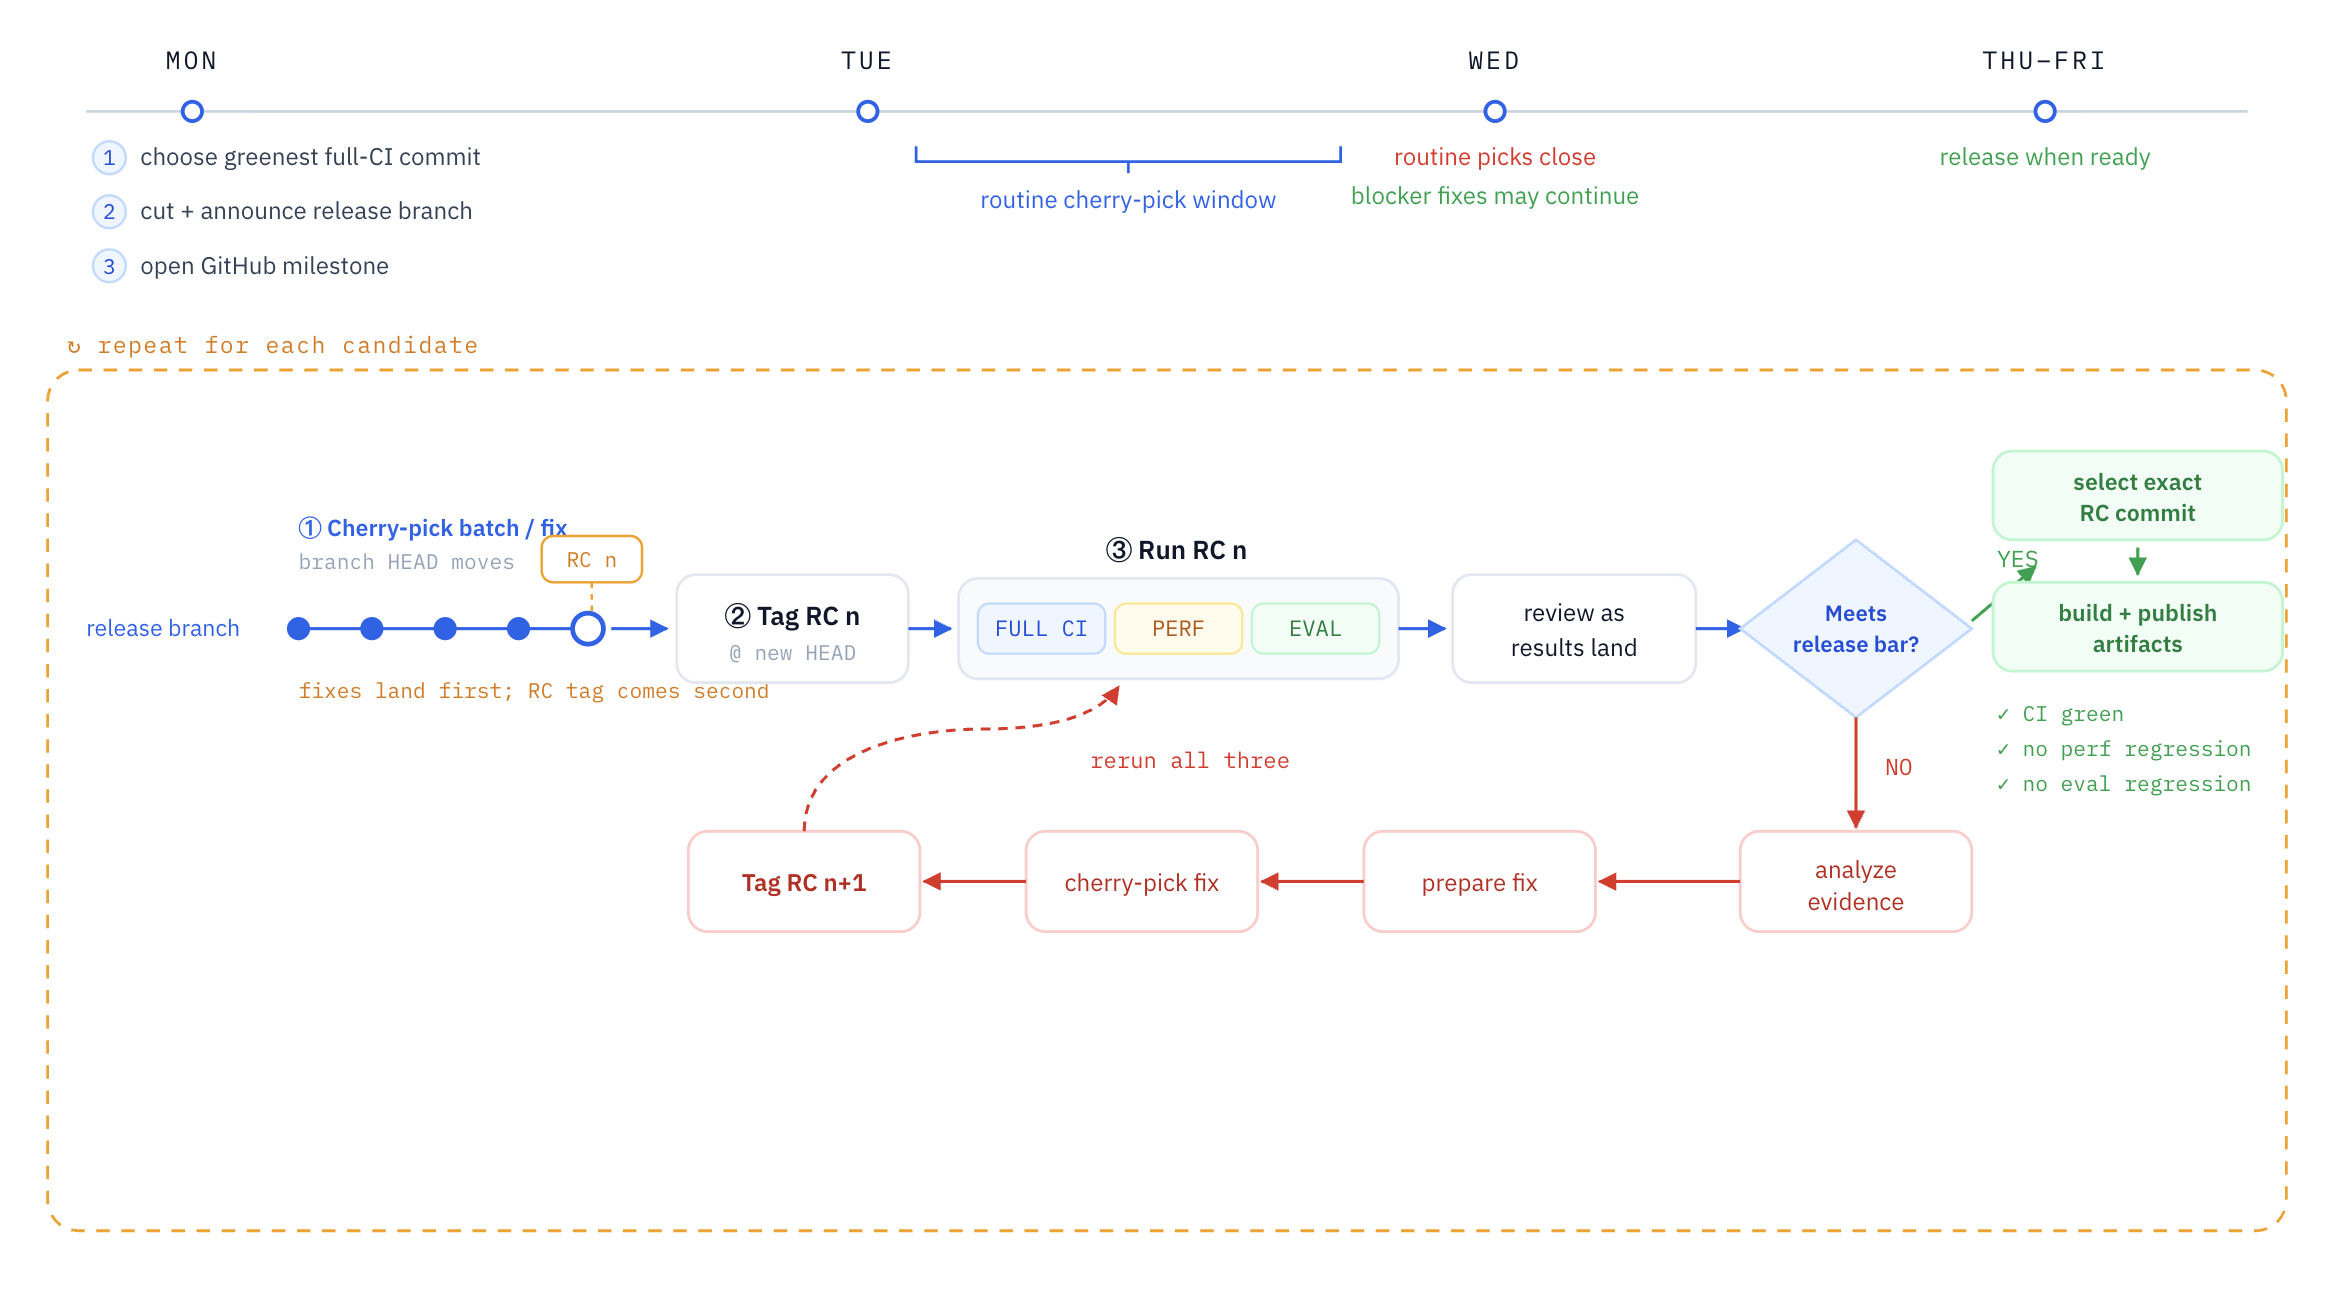
Every other Monday, we kick off release week. Here's what that looks like:
Start from the safest commit
On Monday, the release manager reviews the most recent full-CI runs on the main branch and chooses the greenest commit. That gives the release branch the healthiest available starting point before any release-specific changes are added.
We cut releases/vX.Y.Z at that exact commit and announce the branch and release window.
Heavy testing on every release candidate
From the branch cut through Wednesday, we review the cherry-pick requests, cherry-pick them into the release branch in batches, and tag the result as the next release candidate.
Every candidate goes through the same three gates:
-
Full CI suite
-
Performance benchmark suite
-
Model accuracy evaluation suite
Each result is tied to a release candidate. When a later candidate changes CI health, performance, or evaluation quality, we can track down which candidate introduced the difference: they are just tens of commits away.
We end the cherry-pick window on Wednesday. Then, only fixes for existing issues on release candidates can be cherry-picked, followed by a new release-candidate tag and another run through the three gates, until one candidate meets the bar.
No compromise for the bar
A candidate qualifies only when all three gates pass.
Sometimes there’s no qualifying candidate at the end of the week, and that’s okay. We try our best to release on time, but never compromise our bar just to make it. We treat our new version the way Rockstar treats GTA 6: it’s done when it’s done. We don’t take a decade though…
Ship for every platform
Once a candidate qualifies, we take that commit and start building all the artifacts for different hardware platforms and CUDA versions, ensuring that everyone out there can use vLLM natively. And before anything ships, we smoke test the built artifacts themselves.
At the time of writing, we are shipping these for every release:
-
7 Python wheels:
-
CUDA 12.9 x86_64/arm64
-
CUDA 13.0 x86_64/arm64
-
CPU x86_64/arm64
-
ROCm
-
-
11 Docker images:
-
CUDA 12.9, x86_64/arm64, Ubuntu 22.04/24.04
-
CUDA 13.0, x86_64/arm64, Ubuntu 22.04/24.04
-
ROCm
-
CPU x86_64/arm64
-
What's next
I've been bragging a lot about what we've built — but honestly, we still have a lot to do on our roadmap. Some of the big ones:
-
Automatic test selection. Today we pick which tests run for each PR from a hand-maintained mapping, and it goes stale fast. We want this to be automatic, and we're trying a few angles: LLM-based selection, static analysis, dynamic analysis, and labeling source paths to match them to tests.
-
Faster time-to-signal. CI takes 1–2 hours on average to return a verdict; we'd love to get that under 30 minutes.
-
Leaner unit tests. A lot of our "unit" tests actually spin up a full vLLM server and fire real requests at it, which slows down CI a lot.
-
Better exit-code handling. Some jobs still return the wrong exit code when they fail, like reporting an infra problem as a failed test, making it hard to triage failures and alert/retry jobs.
-
Faster flaky-test detection and quarantine. We have plenty of flaky tests — from infra, upstream packages, or tests that just aren't written safely — and we'd like to catch and quarantine them automatically.
-
Automatic detection for infra issues. Spot a bad machine quickly and pull it out of the CI fleet on its own, before it fails a pile of jobs.
-
Better alerting. We have some basic alerts for congested runner queues and regressions. It’s always nice to have more: high disk pressure on CI runners, jobs suddenly failing far faster than usual, broken dependency installs, etc.
-
Code-coverage reporting. Our coverage is broad, but we can't yet say for sure that every corner of the codebase is actually exercised.
Working on CI is actually a lot more interesting than most people think. This post only covers the high-level process of how we keep vLLM releases stable; there are plenty of fun technical details I didn't get to cover — maybe in another post :)
If any of these problems sound like your kind of fun, or you think we're doing something wrong, come say hi in #sig-ci on the vLLM Slack. And if you'd like to work on this full-time, we're hiring at Inferact~!
Acknowledgements
None of this is a solo effort. vLLM CI is built and kept alive by the whole community.
I'm deeply grateful to everyone who helped with CI along the way (listed alphabetically):
-
Amazon: Junpu Fan, Liangfu Chen, Omri Shiv,
-
AMD: Alexei Ivanov, Andreas Karatzas, Kenny Roche, Micah Williamson
-
Arm: Fadi Arafeh, Ioana Ghiban
-
DaoCloud: Yuqi Wang (noooop)
-
EmbeddedLLM: Tun Jian Tan
-
Google: Brittany Rockwell, Jincheng Chen, Ming Huang, Qiliang Cui, Yarong Mu, Yiwei Wang
-
HuggingFace: Harry Mellor
-
Inferact: Harry Chen, Jiangyun Zhu, Kaichao You, Nick Hill, Roger Wang, Simon Mo, Zhewen Li
-
Intel: Chendi Xue, Jiang Li, Kunshang Ji, Wenjun Liu
-
Meta: Andrey Talman, Charlotte Qi, Eli Uriegas, Huamin Li, Huy Do, Orion Reblitz-Richardson, Reza Barazesh
-
NVIDIA: Alec Flowers, Benjamin Chislett, Mathew Wicks, Pen Chung Li, Stefano Castagnetta, Vadim Gimpelson, Xin Li
-
Red Hat: Andy Linfoot, Avinash Singh, Doug Smith, Edward Quarm, Flora Feng, Lucas Wilkinson, Luka Govedic, Matt Bonanni, Michael Goin, Nicolo Lucchesi, Robert Shaw, Russell Bryant, Tarun Kumar, Tyler Michael Smith, Wentao Ye
-
Reflection AI: Amr Mahdi (contribution made during his time at Meta)
-
Shopee: haosdent
-
Independent contributors: Cyrus Leung (DarkLight1337), Mohammad Angkad
the amazing partners:
-
AWS, Crusoe, LambdaLabs, Nebius, NVIDIA, Roblox, RunPod for sponsoring us with compute credits
-
Buildkite for letting us run CI free of charge on their platform <3
and finally, two mentors who taught me a lot about CI during my time at Anyscale (Ray): Lonnie Liu (now at OpenAI) and Cuong Nguyen (now at NVIDIA).