

From Day 0 to Production SLAs: Serving GLM-5.2 on 24 NVIDIA B300 GPUs with vLLM
TL;DR
We deployed GLM-5.2-NVFP4 across three 8-GPU B300 servers (24 GPUs in total) using a disaggregated 4-Prefill + 1-Decode topology. Under our production SLA targets of mean TTFT ≤ 2.5 s and mean TPOT ≤ 20 ms, we measured the following:
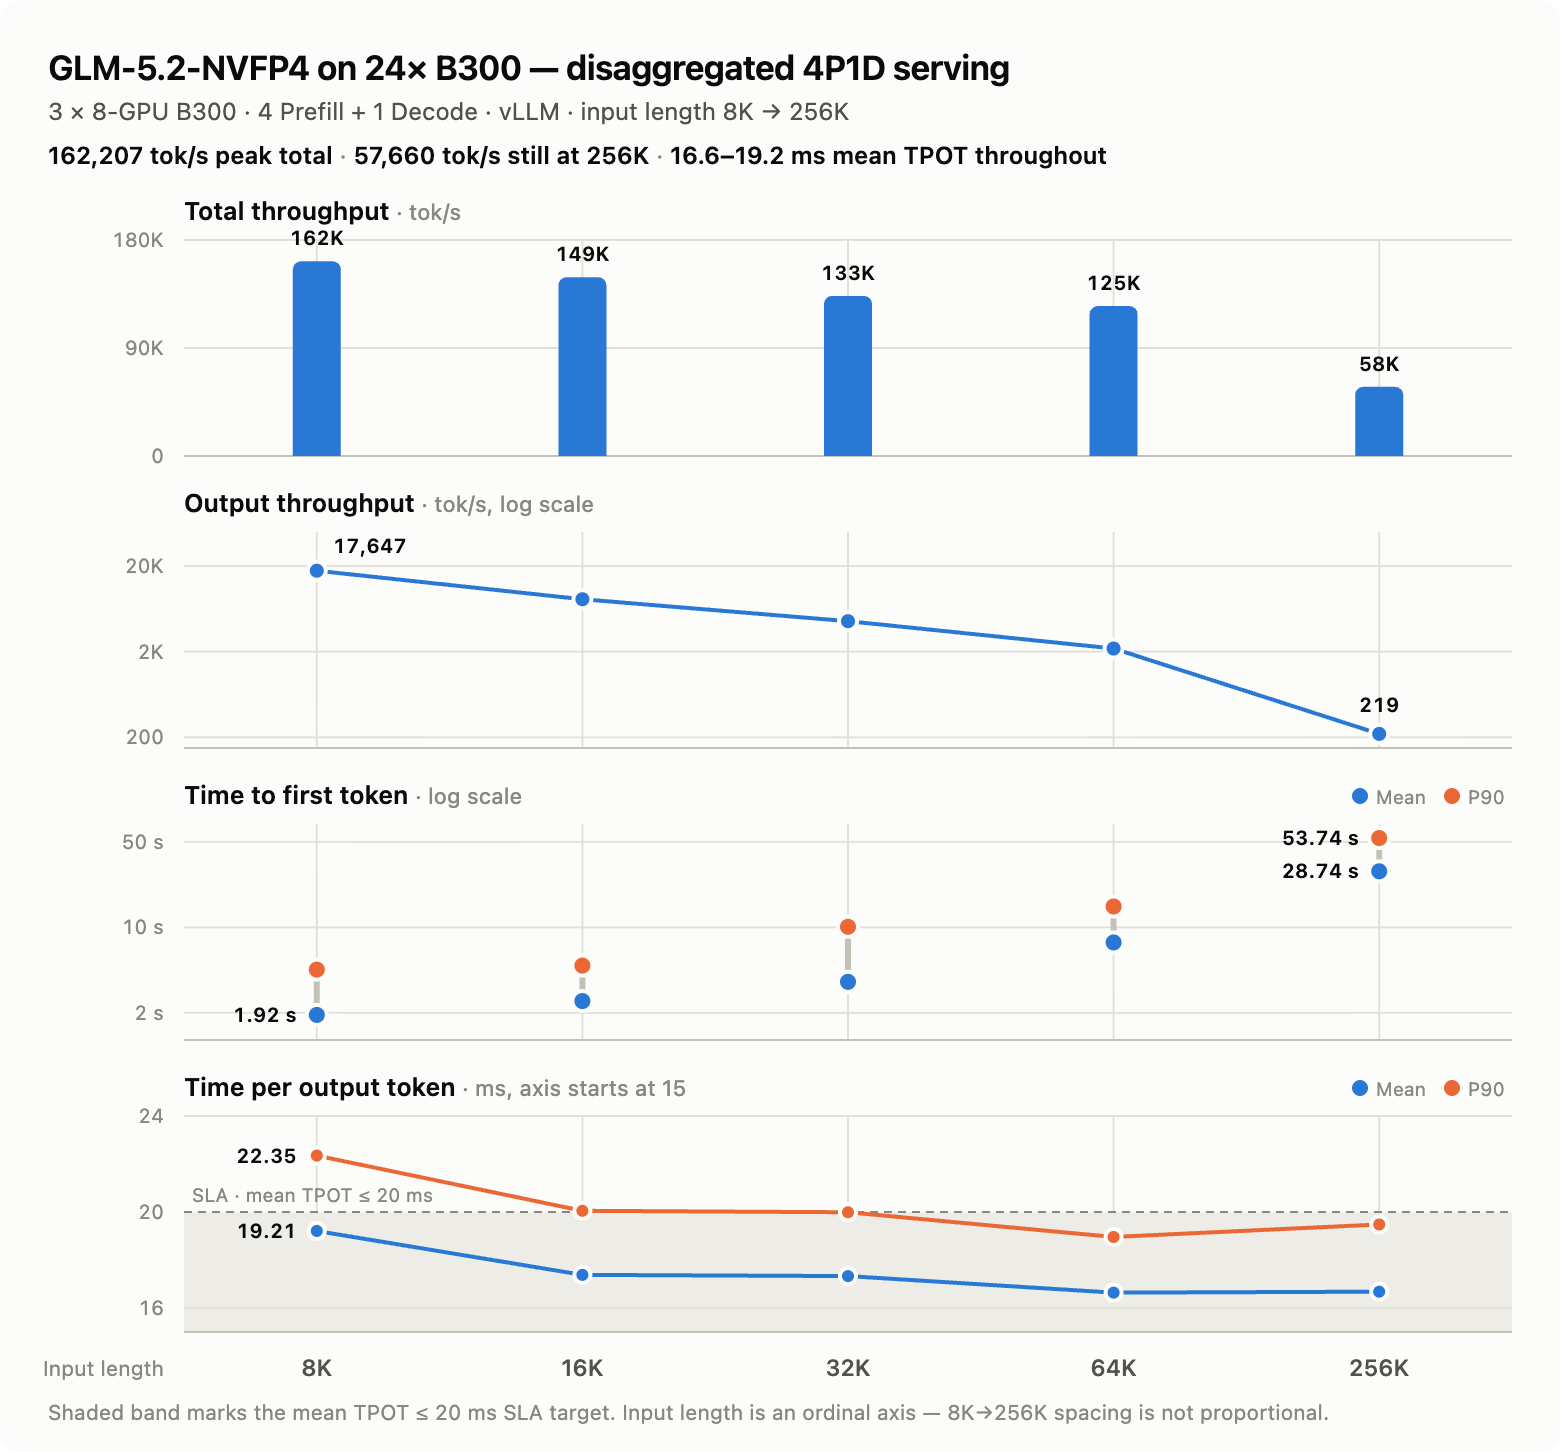
Our starting point on the same hardware was a mean TPOT of nearly 40 ms for 16K-token inputs — roughly twice our SLA limit. This post documents the full journey from 40 ms to 17 ms: what we changed at each step, how much each change contributed, and why the parallelism strategy we shipped is not the one with the highest raw throughput. A complete, reproducible set of vllm serve commands is included at the end.
1. Why We Optimized for SLA Compliance, Not Peak Throughput
In colocated serving, prefill chunks are interleaved into decode batches, and every long prompt entering a batch stretches the inter-token latency of every request already decoding. TPOT tail latency therefore becomes a function of the incoming prompt length distribution — something a serving system does not control. Disaggregation removes prefill work from the decode critical path entirely, making TPOT a function of decode batch composition alone. That is what makes a tight TPOT SLA achievable in the first place, and it is why the rest of this post treats P/D as the starting point rather than as one optimization among many.
Production services are not accepted on peak throughput alone. The real question is how much traffic the system can sustain without violating latency targets. Our requirements were explicit:
- Typical context length: 16K–256K tokens
- Mean TTFT ≤ 2.5 s — the maximum acceptable delay between a user action and the first visible token
- Mean TPOT ≤ 20 ms — roughly 50 tokens/s of streaming output; below this rate, the reading experience degrades noticeably
- Subject to those two hard constraints, maximize throughput
A note on batch size: we did not fix one. Load is applied as a request rate, and concurrency is whatever that rate produces under the SLA — deliberately as large as the latency budget allows. Because prefill cost grows with context length, concurrency settles lower as input length rises: roughly 700 concurrent requests at 8K, 300 at 16K, and 25 at 256K, all under a --max-concurrency 1024 cap.
This objective shaped the methodology throughout: every configuration search was constraint-aware. A configuration that improves throughput by 30% but pushes mean TPOT past the SLA is not useful to us. Section 4 contains a representative example.
GLM-5.2 is a 744B-parameter MoE model with 40B active parameters. It uses DSA sparse attention and natively supports MTP speculative decoding, and vLLM already provides mature support for all three. Our work was to combine them effectively with P/D disaggregation, then tune parameters, topology, and scheduling around production SLA targets.
2. Starting Point: Improving Decode Performance under P/D Disaggregation
With the initial configuration, the Prefill side already met its target and had ample TTFT headroom. The bottleneck was Decode: with 16K input tokens and 1K output tokens, mean TPOT was close to 40 ms, with substantial P99 jitter.
2.1 Root Cause: Mixed Batches at the P/D Handoff
Speculative decoding has become a standard inference-time optimization for large MoE models, and production Decode deployments increasingly run it by default. Profiling revealed an issue that sits precisely at the interaction between P/D disaggregation and speculative decoding.
After a request transfers its prompt KV cache to a Decode node through KVConnector, its first Decode step needs to compute only one token. Existing requests on that Decode node, however, are scheduled with 1 + N tokens per step when MTP is enabled. Because the two request types have different shapes, the step becomes a mixed batch. It can no longer take the uniform-decode full-CUDA-Graph fast path and instead falls back to the more expensive piecewise or eager execution path.
Data parallelism amplifies the impact. Under DP, CUDA Graph mode and padding require coordination across ranks, so if any DP rank receives a newly transferred request, the remaining ranks follow it onto the same execution path. In steady-state P/D operation, new requests arrive at the Decode instance continuously, so the slow path is triggered constantly.
2.2 Optimization: Speculative Padding on the Decode Side
The fix is conceptually simple. On the first Decode step after a request arrives, dummy speculative tokens pad its shape to 1 + N, matching the other requests already in the Decode worker. This preserves uniform Decode execution and keeps the workload on the full-CUDA-Graph fast path.
It requires no transfer of generated tokens or draft tokens from the Prefill node. The optimization was merged by the vLLM community in PR #45237.
2.3 Performance Gain
With the execution-path regression caused by mixed batches eliminated, end-to-end mean TPOT dropped from approximately 40 ms to approximately 22 ms — the single largest improvement of the entire effort.
The result carries a broader lesson for deployments that combine P/D disaggregation with speculative decoding: the largest performance loss may not live in any individual kernel. It can arise at the boundary between subsystems, where small inconsistencies in request state, scheduling shape, and CUDA Graph execution mode are amplified by DP scale and continuous traffic.
3. Further Decode-Side Optimizations
At 22 ms we were close to the SLA but had no safety margin, so we ran another round of configuration search.
3.1 Model Runner V2: 11% Lower TPOT
vLLM Model Runner V2 (MRV2) refactors the runtime execution path. Since v0.25.0 it is the default for all dense models; GLM-5.2 is an MoE model, so it is not enabled by default and must be activated explicitly with VLLM_USE_V2_MODEL_RUNNER=1.
On our Decode configuration, MRV2 improved TPOT by approximately 11% over MRV1. Beyond the shorter execution path, MRV2 brings several capabilities that matter for predictable production latency:
- PR #47285 adds the GLM-5.2 DSA indexer prefill-metadata kernel to startup warmup, so the first production request no longer triggers Triton JIT compilation and a latency spike. This is easy to miss in benchmarks, where warmup absorbs it; in production it shows up as a cold-start spike after every rolling deployment.
- PR #46448 adds local argmax reduction for multi-GPU MTP. With
use_local_argmax_reductionenabled, draft-token generation no longer AllGathers full-vocabulary logits, reducing TP communication from a volume proportional to vocabulary size to approximately 2 × TP size. MTP, EAGLE, DFlash, and other speculators running under MRV2 all benefit. - PR #45953 lets dynamic speculative lengths work with full CUDA Graphs, reducing graph misses and eager fallbacks caused by changes in draft length.
3.2 All-to-All Backend: 4% Lower TPOT
Because GLM-5.2 is an MoE model, the Decode side runs DEP8, which places expert dispatch and combine communication directly on the critical path. We replaced the default AllGather/ReduceScatter-based EP backend with the FlashInfer NVLink A2A backend; in our measurements, flashinfer_nvlink_two_sided cut TPOT by a further 4%.
vLLM now also ships the newer flashinfer_nvlink_one_sided backend, which is expected to perform better. This post keeps the two-sided backend because that is the configuration we actually measured. Evaluating the one-sided backend under the same Decode workload is on our list.
3.3 CUDA Graph Mode
The Decode instance runs --compilation-config '{"cudagraph_mode":"FULL_DECODE_ONLY"}' together with --max-num-batched-tokens 1024. The Decode side does not need graphs compiled for prefill shapes, and FULL_DECODE_ONLY gives complete graph coverage of the Decode path while cutting startup compilation time significantly.
3.4 MTP Speculative Decoding
We use num_speculative_tokens=3 on the Decode side and 1 on the Prefill side. (MTP only becomes cost-effective on GLM-5.2 together with IndexerCache, discussed in Section 5.) The asymmetry is intentional: Prefill nodes should produce and hand off KV cache as fast as possible, so deeper speculation buys little there. Decode nodes sit on the latency-critical path, where deeper speculation amortizes the execution cost per token — provided the acceptance rate stays high.
4. Prefill Parallelism: Why We Did Not Choose the Highest-Throughput Configuration
On the Prefill side we compared several parallelism strategies at 8K- and 32K-token inputs. Since the configurations use different numbers of GPUs, TGS — throughput per GPU — is the meaningful metric.
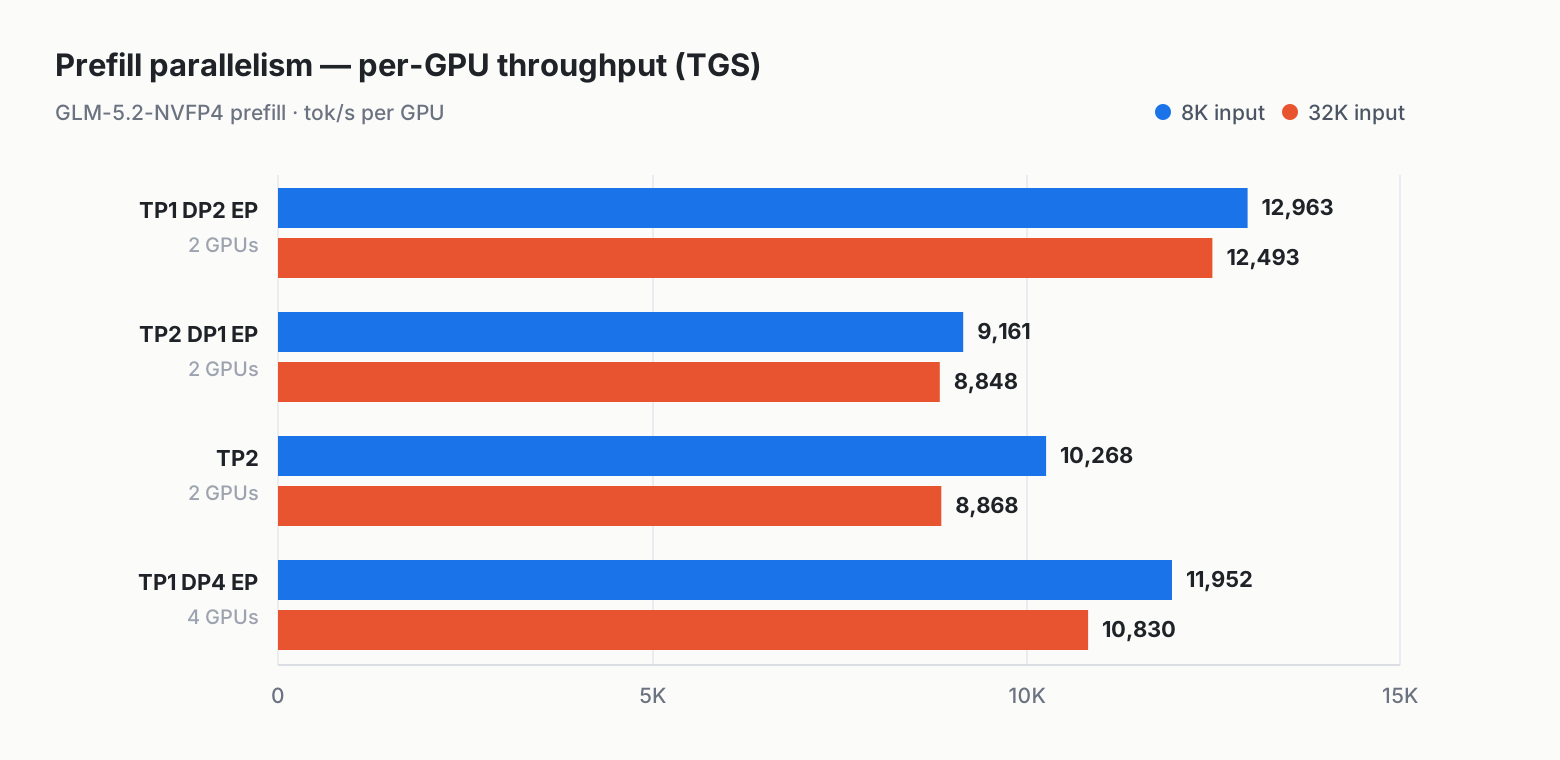
In absolute terms TP1 DP4 EP is the fastest instance — 47,806 tok/s at 8K inputs — but only because it uses twice as many GPUs as the others; per GPU it lands second. Two conclusions stand out:
- TP2 + EP performed worse than plain TP2. At a scale of only two GPUs, the all-to-all overhead introduced by EP exceeds its benefit. EP needs enough experts spread across enough devices to amortize its communication cost.
- TP1 DP2 EP achieved the best TGS, but we shipped TP1 DP4 EP.
The second point is where production engineering parts ways with benchmark chasing. TP1 DP2 EP delivered the best per-GPU efficiency, but each instance had only two GPUs, leaving too little KV-cache capacity for GLM-5.2's 1M-token context capability. We were not willing to give up one of the model's most important features for an 8% TGS advantage, so we chose TP1 DP4 EP — trading roughly 8% of per-GPU efficiency for the KV-cache capacity of four GPUs per instance.
5. MTP + IndexerCache: How We Improved the Acceptance Rate
vLLM has been extensively validated in production under conventional configurations. This deployment enabled three relatively new capabilities at once — P/D disaggregation, MTP, and MRV2 — which put us on a less frequently exercised combination path, and the tuning process surfaced several long-tail issues. Most fixes went from report to release within a few days; anyone on v0.26.0 already has all of them. This section records the work to show how MTP acceptance was stabilized step by step.
5.1 IndexerCache: Making MTP Cost-Effective with DSA
IndexerCache (PR #44420) is not a conventional KV cache — it reuses the Top-K sparse indices produced by the DSA indexer. A naive implementation reruns the indexer for every MTP draft step, and since sparse-retrieval cost grows with context length, that can consume much of the benefit expected from speculative decoding. PR #44420 introduced index_share_for_mtp_iteration, which lets the first draft step compute Top-K indices and subsequent draft steps reuse them. This is a prerequisite for MTP to be worthwhile on GLM-5.2 at all.
The community then completed three improvements around this mechanism, which together stabilized acceptance under high concurrency:
- PR #45895 improves indexer initialization when Top-K layers are skipped and fixes the GLM-5.2 MTP normalization loop. The PR reports that on GLM-5.2-FP8 with TP=8, mean accepted length rose from approximately 3 to approximately 4, at an average acceptance rate of about 60%, while IFBench held at 74.62.
- PR #47238 optimizes the layout of the shared index buffer for batched requests: after the first draft step, it retains only the Top-K indices corresponding to each request's final query token. This was the key step in extending index sharing from single-request execution to high-concurrency batching.
- PR #47448 ensures the MTP loop reuses the post-final-norm hidden state.
Taken together, IndexerCache is not merely a compute-saving optimization. It is also a key mechanism for holding MTP acceptance rates up under high concurrency.
5.2 Two Additional Fixes for the Combined Configuration
MRV2 scheduling classification. After switching to MRV2, we observed excessive TPOT variance under a specific benchmark pattern and reported it in Issue #47239. The community quickly traced it to uniform-decode ordering: speculative-decoding steps were being classified as prefill and therefore took a slower execution path. PR #47381 fixed it.
Lookahead handling for asynchronous KV loading in P/D deployments. PR #46694 improves slot-allocation timing for the combined GLM-5.2 + NIXL P/D + MTP configuration. The Decoder now waits until remote KV transfer completes before allocating speculative-token slots, correctly handling the boundary case of a final partial KV block. This partial-block handoff is specific to the interaction between P/D disaggregation and speculative decoding, and fixing it was another step toward making the path production-ready.
Both fixes are included in v0.25.0 and later releases.
5.3 Accuracy Validation
We ran a set of public benchmarks with the final configuration to verify that combining NVFP4 quantization, MTP, and P/D disaggregation did not reduce output quality:
| Test Item | Score |
|---|---|
| AIME 2025 | 86.67 |
| GPQA | 92.89 |
| LongBench V2 | 64.01 |
| MMLU-Pro | 86.3 |
| SWE-bench Verified (Agentic) | 85.2 |
The results are consistent with community-reported GLM-5.2 numbers. LongBench V2 mattered most to us because it directly exercises DSA sparse attention and IndexerCache index sharing under long contexts. A score of 64.01 indicates that index sharing holds up in long-context workloads, and that the speedup from speculative decoding did not come at the expense of output quality.
6. Upstream Progress
The capabilities used in this deployment build on a broader set of optimizations coordinated by the vLLM community under the GLM-5.2 optimization tracking issue, Issue #46654. Beyond the PRs referenced above, two developments are especially relevant.
A secondary tier for P/D disaggregation. PR #42285 introduces a unified CPU KV-cache layout as an intermediate layer. TieringManager coordinates the primary cache tier and the P/D connector, reducing coupling between the transfer backend and the model execution path. Merged in v0.25.0.
PCP virtual batching for long-context Prefill. PR #46570 splits requests into multiple virtual batch rows processed in parallel across context-parallel ranks, aggregating only the MLA latent cache and DSA indexer cache. In an initial 4-GPU GLM-5.2-NVFP4 / 32K Prefill test, TP=2 with PCP=2 raised prompt throughput from approximately 20.1K tok/s to approximately 27.3K tok/s. The PR was merged into main on July 19, 2026, and will ship in the next release. Since KV-cache capacity is exactly why we rejected the TGS-optimal configuration in Section 4, PCP may change that trade-off, and it is a key focus of our next validation phase.
7. Observability: Verifying the SLA after Production Launch
Passing a benchmark does not make a system production-ready. Observability is harder for a disaggregated P/D deployment than for a single instance, because request latency is split across two resource pools: TTFT is determined mostly by the Prefill pool, TPOT by the Decode pool, with a KV transfer in between. When any stage degrades, users see only one symptom — the service got slower.
We built monitoring for the P/D topology with Prometheus and Grafana. In production we watch the following metric groups:
- Per-pool TTFT and TPOT percentiles, not just end-to-end aggregates. This is the first place to look to decide whether a problem belongs to Prefill or Decode.
- MTP acceptance rate and mean accepted length. Easy to overlook, yet among the earliest warning signals available. A declining acceptance rate produces no error; TPOT simply degrades gradually. In practice this is the first dashboard we open for any Decode-side anomaly, and we recommend treating MTP acceptance rate as a first-class alerting metric.
- KV-cache utilization versus GPU utilization, on both the Prefill and Decode sides. The central benefit of P/D disaggregation is that the two resource types scale independently; the relative levels of these curves are the scaling signal.
- KV-transfer latency and queue depth, to determine whether the inter-node network has become the bottleneck.
7.1 A Problem Visible Only during Long-Running Stability Tests
Short benchmarks validate performance, not long-term stability. Our production acceptance process includes multi-day continuous runs, and that step revealed persistent host-memory growth: vLLM process RSS increased linearly over tens of hours without reaching a plateau.

Several characteristics explain why this issue needed production monitoring, rather than a benchmark, to be discovered:
- The growth rate was slow and only visible over hours. A
vllm bench serverun lasting seconds or minutes could not reveal it. - The growth affected host memory, not GPU memory. Every GPU-side metric looked normal.
- Conventional memory-analysis tools could not see it.
EngineCorecallsgc.freeze()during startup, so the leaked objects never appeared ingc.get_objects()ortracemalloc; the symptom looked like allocator fragmentation.
We reported the behavior and our initial diagnosis to the community in PR #47723, and a maintainer incorporated it into PR #44490.
The root cause was inconsistent gating between a producer and a consumer. PR #35219 had introduced SingleTypeKVCacheManager.new_block_ids for clearing Mamba SSM cache state. Entries were recorded based on the KV-cache spec type — FullAttentionSpec, MLAAttentionSpec, and so on — but cleared only when the model contained Mamba layers. For models without Mamba layers, which includes most standard attention models and GLM-5.2 with MLA, every block allocation was recorded and the list was never drained, so it grew without bound as request volume increased. The fix was to drain take_new_block_ids() unconditionally on every scheduling step and use its result only when clearing is actually required. Mamba behavior is unchanged.
8. Complete Deployment Recipe
8.1 Environment
| Deployment | Configuration |
|---|---|
| Hardware | 3 × 8 B300 (24 GPUs) |
| Model | GLM-5.2-NVFP4 |
| Topology | 4 Prefill (TP1 DP4 EP, 4 GPUs each = 16) + 1 Decode (TP1 DP8 EP = 8) |
| KV Transfer | NIXL |
8.2 Prefill Node
export VLLM_USE_V2_MODEL_RUNNER=1

vllm serve /mnt/model/glm/GLM-5.2-NVFP4 \
    --trust-remote-code \
    --kv-transfer-config '{"kv_connector":"NixlConnector","kv_role":"kv_producer"}' \
    --chat-template-content-format=string \
    -ep \
    -tp 1 \
    -dp 4 \
    --tool-call-parser glm47 \
    --enable-auto-tool-choice \
    --reasoning-parser glm45 \
    --gpu-memory-utilization 0.92 \
    --enable-prompt-tokens-details \
    --speculative-config='{"method":"mtp","num_speculative_tokens":1}' \
    --shutdown-timeout 300 \
    --fingerprint-mode=none
8.3 Decode Node
export VLLM_USE_V2_MODEL_RUNNER=1

vllm serve /mnt/model/glm/GLM-5.2-NVFP4 \
    --trust-remote-code \
    --chat-template-content-format=string \
    --kv-transfer-config '{"kv_connector":"NixlConnector","kv_role":"kv_consumer"}' \
    --compilation-config '{"cudagraph_mode":"FULL_DECODE_ONLY"}' \
    --max-num-batched-tokens 1024 \
    -ep \
    -tp 1 \
    -dp 8 \
    --tool-call-parser glm47 \
    --enable-auto-tool-choice \
    --reasoning-parser glm45 \
    --gpu-memory-utilization 0.90 \
    --enable-prompt-tokens-details \
    --all2all-backend=flashinfer_nvlink_two_sided \
    --speculative-config='{"method":"mtp","num_speculative_tokens":3}' \
    --shutdown-timeout 300 \
    --fingerprint-mode=none
8.4 Benchmark Methodology
All performance data was collected with the random dataset in vllm bench serve. There were no prefix-cache hits, so the TTFT figures represent worst-case, compute-only latency. Requests were injected at a fixed --request-rate, computed as target TPS divided by (input_len + output_len) and multiplied by a tuning factor.
vllm bench serve \
  --backend openai-chat \
  --model /mnt/model/glm/GLM-5.2-NVFP4 \
  --endpoint /v1/chat/completions \
  --dataset-name random \
  --random-input-len 16384 \
  --random-output-len 1000 \
  --request-rate <target TPS / (input + output) × tuning factor> \
  --percentile-metrics ttft,tpot,itl,e2el \
  --metric-percentiles 50,90 \
  --save-result
9. What Comes Next
For GLM-5.2 and the larger MoE models that will follow, we see two major directions for Decode optimization. The following are forward-looking assessments rather than conclusions measured in this post.
First, reduce the cost of each target forward pass. Beyond core kernels such as GEMM, Attention, and the Indexer, this includes exploring PDL, persistent kernels, localized megakernels, and coordinated computation and communication across MoE Dispatch, Expert GEMM, and Combine. As deployments scale across nodes, WideEP, hierarchical all2all, and overlap between inter-node communication and computation become increasingly important. The objective is to shorten the end-to-end critical path of a complete Decode step.
Second, advance model–runtime co-optimization for speculative decoding. On the model side, stronger drafters such as DSpark can be trained on broader datasets to improve the accuracy of consecutive proposal tokens. On the runtime side, dynamic speculative decoding, per-request proposal lengths, and compact verification can keep verification cost in check across different workloads. The draft model determines how far the system can predict; the serving runtime determines how far prediction is actually economical.
In addition, the PCP virtual-batch work described in Section 6 has already landed in main. We will evaluate whether it removes the KV-cache-capacity versus per-GPU-efficiency trade-off discussed in Section 4.
About Us
This work was completed by the DaoCloud team. We deliver full-stack platforms for enterprise LLM training and inference, including heterogeneous accelerator scheduling, inference-service orchestration, and observability. We shared our observations and validation results with the vLLM community throughout the tuning process, and the resulting improvements were merged upstream. The configuration in this post can be used directly with v0.26.0.
Special thanks to Nicolò Lucchesi (@NickLucche) from Mistral AI, who suggested writing this post in the first place, reviewed it in detail, and kept it moving from a rough set of notes to what you have just read.
We also thank the vLLM community for its efficient collaboration under Issue #46654. In most cases, fixes moved from initial report to a released version within one week.