

MAGI-2 Preview on vLLM-Omni: Bringing a 114B Audio-Video MoE DiT to Moore Threads MUSA with torchada
torchada first gets MAGI-2 Preview running on Moore Threads MUSA; optimizations along the execution path then follow one at a time. The first working version needed 15.6 s per denoising step; with every PR below applied, the newest measurement is 565 ms, and #8855 alone is 14.5% on its own paired A/B.
MAGI-2 Preview is Sand AI's audio-video generation model: about 114B parameters in total, about 6B active per token, and one generation produces a 10-second video with synchronized stereo audio, from text (T2VA) or an image (I2VA). Its backbone is a single-stream DiT that packs text, video and audio tokens into one sequence; its MoE routes per "head", and its residual uses mHC hyper-connections. That combination gives it an inference cost profile unlike common video DiTs.
vLLM-Omni already supports MAGI-2 Preview natively. On Moore Threads MTT S5000, this implementation runs with only a few per-platform changes: torchada maps CUDA-style PyTorch calls to MUSA, and the model's CUDA-authored Triton kernels also run as-is. We then optimized along the execution path and submitted each change as its own PR.
On 8× MTT S5000, MAGI-2 Preview at 272p and 100 steps runs at 565 ms per step with static compilation and every PR of this post applied (Section 5.3). A single number says little, so the claims are paired: a within-session A/B measured 691 ms for the control and 590–591 ms with the last change, 14.5% and bit-identical (Section 5.2), and Section 5.1 reports 665–670 ms static and 678–684 ms dynamic for the PR round's tree. Those sections use different trees and sessions and are not compared with each other. Static compilation leaves the output bit-identical except for the mHC contraction of #8510, which changes the summation order. Section 2.1 defines "per step".
1. Why MAGI-2 Preview is a different inference problem
MAGI-2 Preview has a single DiT backbone, and text, video, and audio share one self-attention sequence. Figure 1 shows that stage and, below it, the refiner that Sand AI adds for 1080p output:
text prompt (+ first-frame image) -> Qwen3.5-27B text encoder / Wan2.2 VAE encoder
                                  -> single-stream DiT × 100 steps (two CFG branches)
                                  -> TurboVAE (video) + Stable Audio Open (audio) -> 540p output

1080p tier (in review as #8915, not measured here):
  Preview video latent -> upsample + renoise -> 6.7B dense refiner × 5 steps -> TurboVAE -> 1920×1088
  audio: decoded once in the Preview stage, reused unchanged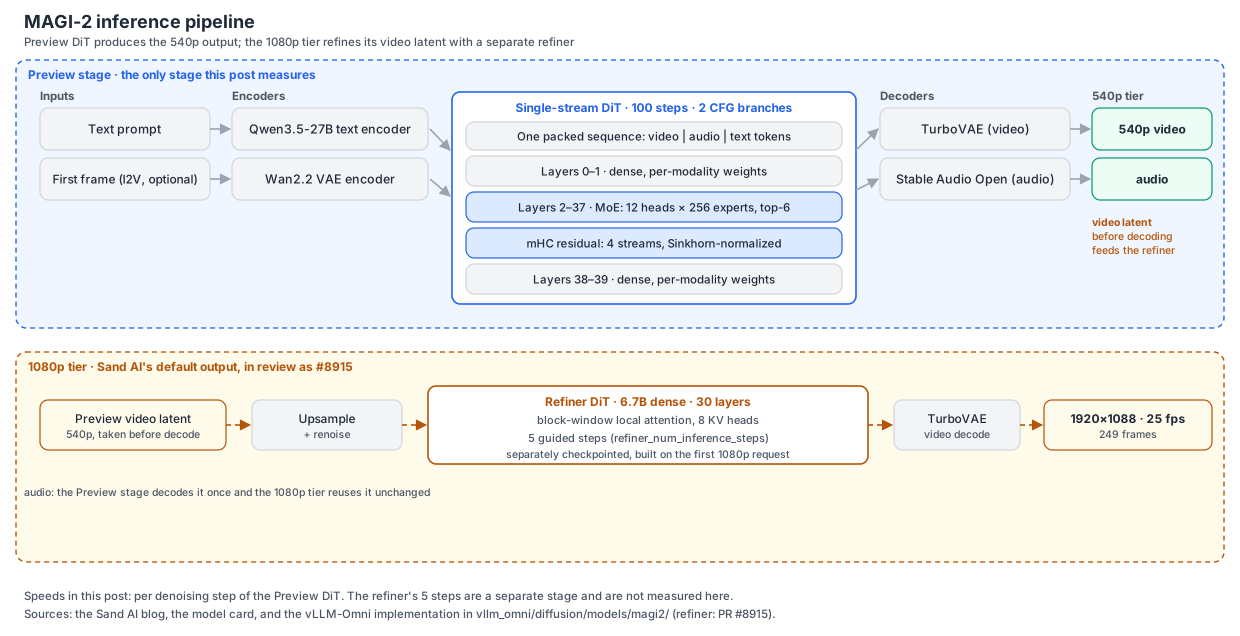
Figure 1: MAGI-2 inference pipeline. The Preview stage (upper band) is the only stage this post measures: of its 40 layers, the 4 at the ends are dense with per-modality weights and the middle 36 are multi-head MoE, with mHC mixing the residual streams. Sand AI's 1080p tier (lower band) takes the Preview latent before decoding, upsamples and renoises it, runs 5 guided steps of a separately checkpointed 6.7B dense refiner with block-window attention, then decodes; audio is decoded once and reused. The refiner is in vLLM-Omni as #8915. Sources: the Sand AI blog, the model card, and vllm_omni/diffusion/models/magi2/.
- One sequence, three modalities: video latents, audio latents, and text features are packed into one variable-length sequence in "video → audio → text" order, with no cross-attention. The 4 layers at the two ends (layers 0, 1, 38, and 39) have a separate set of weights for each modality.
- No adaLN: the timestep is written directly into the first 64 channels of each token as a 64-dimensional sinusoidal encoding, so video and audio can each have their own timestep.
- Multi-head MoE (layers 2–37): each 3072-dimensional token is split into twelve 256-dimensional "heads", and each head selects top-6 among its own 256 experts. Each expert is a 256→1280→256 SwiGLU7, and there are also 1 shared expert and 3 per-modality shared experts. Routed experts account for 95% of all parameters.
- mHC hyper-connections: the residual has 4 streams, 12288 wide in total. Each branch first computes mixing coefficients with an FP32 [12288×24] projection. The 4×4 residual mixing matrix among them is normalized into a doubly stochastic matrix with 20 Sinkhorn iterations (mHC paper).
- Attention: 24-head full multi-head attention, head_dim 128, bidirectional; each head has a learned FP32 attention sink, and the output is multiplied by a sigmoid gate.
- Sampling: 100 steps, and the DiT is not distilled. Each step runs two CFG branches, and the full 10 seconds is denoised at once rather than in MAGI-1's autoregressive chunks.
| Item | Value |
|---|---|
| Parameters | 114B total, about 6B activated per token |
| Backbone | 40 layers, hidden 3072, 24 heads × 128 |
| MoE | Layers 2–37; 12 heads × 256 experts, top-6 per head |
| Residual | mHC, 4 streams, 20 Sinkhorn iterations |
| Output | 10 s, 125 frames, 12.5 fps, 44.1 kHz stereo; vLLM-Omni supports 272p (448×256) and 540p (896×512) |
| Sampling | 100 steps, CFG video 5.0 / audio 7.0 |
| 272p sequence length | About 14,600–15,000 tokens per CFG branch, 29,616 for both combined |
Among the open video models in the table below, only MAGI-2 Preview combines per-token MoE routing, mHC hyper-connections, and audio and text in the same self-attention sequence:
| Model | Parameters (total / active) | Backbone | Text encoder | MoE | Audio | Autoregressive |
|---|---|---|---|---|---|---|
| MAGI-2 Preview | 114B / about 6B | Single-stream self-attention DiT; text, video, and audio in one sequence | Qwen3.5-27B | Yes, routed per token per head | Joint generation | No |
| MAGI-1 | 24B / 24B | Block-causal self-attention + cross-attention | T5 | No | No | Yes, in 1-second chunks |
| Wan 2.1 | 14B / 14B | Cross-attention DiT | umT5 | No | No | No |
| Wan 2.2 A14B | 27B / 14B | Two full DiTs, switched by noise stage | umT5-xxl | Switches the whole model by timestep; no routing | No | No |
| HunyuanVideo 1.5 | 8.3B / 8.3B | Dual-stream DiT, sparse attention | Qwen2.5-VL + Glyph-ByT5 | No | No | No |
| CogVideoX | 2B or 5B, dense | Text and video concatenated into one sequence, per-modality adaLN | T5 | No | No | No |
| LTX-2 | 19B / 19B | Dual-stream audio-video, bidirectional cross-attention in every block | Gemma 3 12B | No | Joint generation | No |
| Ovi | 11B / 11B | Twin video and audio DiTs with mutual cross-attention | T5 | No | Joint generation | No |
| Open-Sora 2.0 | 11B / 11B | MMDiT (dual-stream + single-stream blocks) | T5-XXL + CLIP-L | No | No | No |
For inference, these differences come down to four concrete problems:
- Head-sharded MoE: routing happens on 256-dimensional sub-vectors, so the expert GEMMs are small (K=256, N=2560 and K=1280, N=256) but numerous, and expert parallelism can only shard along the "head" dimension.
- mHC is many small FP32 operations: the residual stream carries 4 times the bytes of a normal residual, and each branch also runs 20 Sinkhorn iterations, so mHC is bound by memory traffic and kernel launch count.
- Text also goes through the full model: text tokens pass through attention and MoE at every step. The two CFG branches are packed together, so attention must support sinks and variable-length splitting.
- 100 undistilled steps: almost all end-to-end time is spent in the DiT, so per-step time is the main lever.
2. Measurement conventions and evidence boundaries
This post reports three kinds of evidence separately:
| Evidence lane | Purpose |
|---|---|
| First pass (September, bring-up) | The optimization trajectory from the first run to the first usable version |
| Second pass (October, upstream PRs) | Formal results: the results in Section 5 and the individual gains in the Section 7.1 table are measured with the same method and checked bit for bit; each section is compared only within itself |
| Generated samples | Show the visuals and sound; not used for timing |
The two passes use different code trees, so no per-change gain in this post crosses that boundary. The one number that spans both is the headline 15.6 s to 566 ms of Section 4: it measures the work as a whole, not two code states against each other, and the figure marks where the baseline resets.
2.1 Frozen controls
| Control | Setting |
|---|---|
| Hardware | 8× MTT S5000 for every number in this post. The sections differ in code tree and in session, so absolute numbers are compared only within one section; the September trajectory, the early-October per-change ablations, and the profiles show trends and locate bottlenecks |
| Software stack | vLLM 0.28 + vllm-musa; torch / torch_musa 2.11.0.post2 (MUSA SDK 5.2.0); MATE / flash_attn_3 0.2.7; Triton 3.2.0; torchada (including #120) |
| vLLM-Omni | Upstream main of October 4 (c1e84ce94) plus #8496–#8498, #8506, #8510, #8511 and #8593–#8595, at the PR contents of October 7–8; Section 5.3 uses the October 19 contents and adds #8592, #8855 and the #8915 refiner branch. #8627 is not included. These trees run on the vLLM 0.28 base with a test-only compatibility layer; the image in Appendix A.2 is a later tree and needs none |
| Workload | T2VA, 272p (448×256), 125 frames, 10 seconds, 100 steps, seed 42, fixed prompt "A golden retriever running through a sunlit meadow, cinematic camera movement" |
| Parallelism | SP8×CFG1+EP4 as the main configuration; SP4×CFG2 and SP4×CFG2+EP4 as controls |
| Reproduction | Appendix A.2 pins the stack as a container image, digest included; it is a later tree than these tables |
| Compilation | Regional torch.compile; static compilation and dynamic compilation are measured separately. On MUSA, dynamic compilation is only correct on a tree that carries #8594 (Section 4.6) |
| Timing | Per denoising step (sampler.diffuse): maximum across the 8 ranks, steps 0 and 1 dropped, mean of the other 98. The boundary is that of #7274, since closed; the instrumentation used here is the measurement-only patch of Appendix A.3 |
| Correctness | Compare the sha256 of the decoded video frame array and audio array; each run uses a fresh Inductor cache (see Appendix A.5) |
Parallel configuration notation in this post: SP is Ulysses sequence parallelism; CFG is CFG parallelism, which places the two CFG branches on different GPUs (CFG1 and CFG2 in the configuration names count how the two branches are placed, not the guidance scales of 5.0 and 7.0); EP is MAGI-2's head-sharded expert parallelism (see Section 4.5).
Comparisons are made within one row only: same tree, same parallel configuration, same compilation mode, with the versions before and after each optimization run alternately. Every performance number is paired with a correctness check — under static compilation the output hashes before and after are identical. The exception is the first commit of #8510, which changes the summation order and is checked against an FP64 CPU reference instead (Section 4.3).
3. Running a CUDA-first model on MUSA with torchada
MUSA is Moore Threads' GPU programming environment, with interfaces designed to align with CUDA. On the PyTorch side, torch_musa provides the musa device. On top of it, torchada maps CUDA-style calls to MUSA so that code written for CUDA runs as usual. Figure 2 shows the MAGI-2 software stack on MUSA.
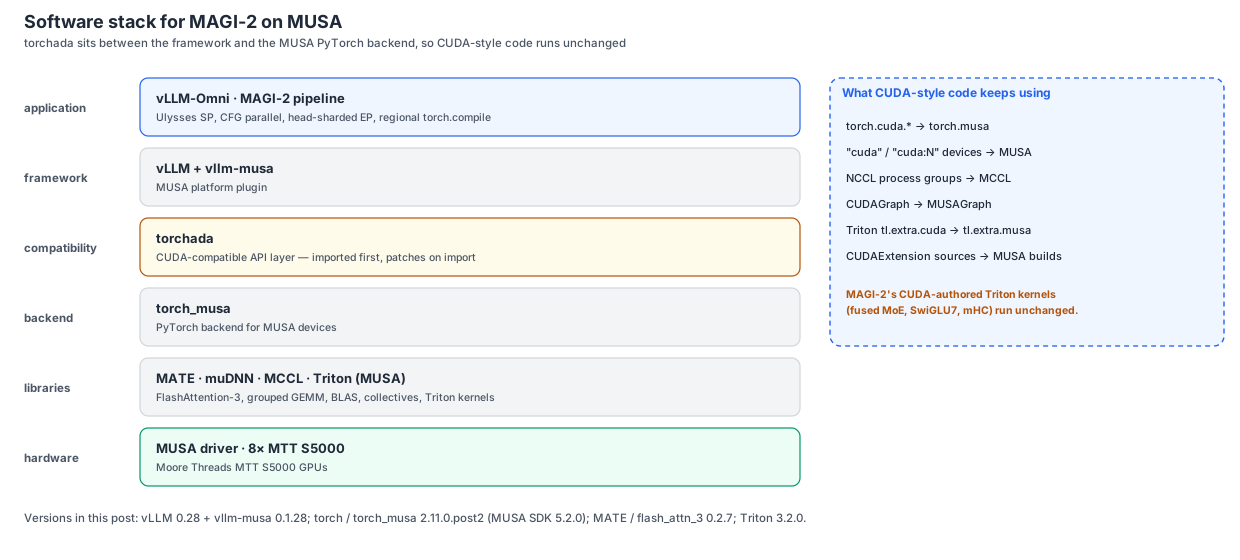
Figure 2: MAGI-2 software stack on MUSA. torchada acts at import time, mapping CUDA-style calls (torch.cuda, the "cuda" device, NCCL/MCCL, CUDA Graph/MUSAGraph, Triton extensions) onto torch_musa and the libraries below it. Sources: torchada, torch_musa, MATE, vllm-musa, #8498.
3.1 What is reused directly
With torchada imported, most of MAGI-2's code in vLLM-Omni runs on MUSA as-is:
- Eager PyTorch code: CUDA-style tensor, device, and stream operations work directly.
torch.compile/ Inductor: the MUSA platform supports Inductor, and regionaltorch.compilecuts per-step time by about 16% compared with eager.- CUDA-authored Triton kernels: the upstream fused BF16 MoE (#7206), SwiGLU7 (#7252) and mHC (#7261) kernels run as-is on MUSA Triton 3.2. Two things are selected per platform: the launch configuration (
BLOCK_SIZE_K=64,num_warps=16,num_stages=1on MUSA; 32 / 4 / 3 on CUDA), and the MoE path, since MUSA always takes the fused BF16 path that needs no atomics (Section 3.3). - Distributed: Ulysses all-to-all and head-sharded expert parallelism both run through ProcessGroupMCCL, which is faster than the PyNccl path that loads
libmccldirectly (780.7 vs 823.7 ms/step).
3.2 How torchada maps CUDA-style APIs
import torchada  # import before other torch-ecosystem imports
import torch

torch.cuda.is_available()          # False: left unpatched so platform detection stays truthful
torch.version.musa                 # 50200; platform checks use this
x = torch.randn(4, device="cuda")  # the tensor lands on musa:0
x.is_cuda # True: intentional, so CUDA-style code paths run as usualtorch.cudapoints totorch.musa, and submodules such as amp, stream, graph, memory, and profiler are mapped with it."cuda"/"cuda:N"device strings,torch.device("cuda"),.cuda(), and.to("cuda")all land on MUSA.- NCCL process groups map to MCCL, CUDA Graph to MUSAGraph, and the profiler's CUDA activity to MUSA.
- Triton's
tl.extra.cudamaps totl.extra.musa;CUDAExtensionsources are ported to MUSA automatically at build time. torch.cuda.is_available()andtorch.version.cudaare intentionally left unchanged; platform checks usetorch.version.musaor the framework's platform interface.
3.3 Adaptation notes
A few items still need handling on top of the compatibility layer. MUSA-specific choices are either solved once in torchada or placed behind a platform check; the CUDA path is unchanged. Routing counts (#8496) and the dynamic-shape pinning (#8627) are generic code for all platforms; they leave output unchanged and their CUDA cost was not measured:
| Area | How MAGI-2 handles it on MUSA | Applied in | PR |
|---|---|---|---|
| CUDA-only kernels | torchada makes is_cuda True for MUSA tensors, so CUDA-style code runs as usual. Kernels that exist only in CUDA builds (such as vLLM's bundled FlashAttention) are gated by a platform check, q.is_cuda and current_omni_platform.is_cuda(); #7175 uses the same check | Platform check | #8498 |
| Accelerator check | The pipeline entry point accepts CUDA-like platforms: is_cuda() or is_musa() | Platform check | #8498 |
| Attention | Uses the FlashAttention-3 interface provided by MATE (flash_attn_3 varlen), and adds learned attention sinks as an FP32 LSE correction. Packed batches of fewer than 32 tokens use the Torch reference implementation. BF16 correctness tests use MATE FMHA's own tolerance (rtol 0.01, atol 0.015) | Model code | #8498 |
torch.isfinite | ATen builds isfinite from a boolean mul, which on torch_musa 2.11 drains the device queue. torchada computes the equivalent abs() < inf for MUSA floating-point tensors, with identical results, so SGLang and other torchada-based frameworks benefit too | torchada | torchada #120 |
| Routing counts | Uses int32: counts never exceed the number of routes, so results are bit-identical; int32 is the faster path on MUSA | Generic code | #8496 |
| GEMM operand layout | torch_musa's bmm reads batch-contiguous operands directly and rearranges batch-interleaved operands first. The preceding mHC norm therefore writes the "stream-major" layout directly, saving 80 copies per step | Model code (MUSA branch) | #8510 |
| Dynamic shapes | Under Inductor dynamic shapes, sizes are passed to Triton as int64; pinning the non-token dimensions with torch._check restores 32-bit index arithmetic. We did not measure the effect on CUDA | Generic code | #8627, #8595 |
| MUSA Triton 3.2 | Triton-MUSA 3.2 does not yet provide BF16 tl.atomic_add, so MUSA always selects the fused BF16 MoE path that needs no atomics. Inductor passes runtime floating-point arguments to user kernels as FP64, so the Sinkhorn kernel's epsilon becomes a tl.constexpr and is computed in FP32 | Kernel config | #7206, #8594 |
| Floating-point precision | Device code stays in FP32/BF16; FP64 appears only in CPU test references. The tested MUSA platform reports no device FP64 — MusaPlatform.supports_float64() returns False (platform.py#L126-L128) — which limits the tested PyTorch path, not the hardware | Model code | — |
| Graph capture | MUSAGraph captures MAGI-2's regional graphs correctly, with consistent output; for this model, regional compilation without graph replay is currently faster | Runtime config | — |
Separately, while reviewing the third-party PR #7545 (fused mHC post_residual, still open), we suggested replacing the PTX inline-assembly add.rn.f32 with tldevice.fma_rn(a, 1.0, b) on MUSA. The two give identical results, and the PTX generated on CUDA does not change.
torchada also improved along the way: device construction for the FX eager / aot_eager backends (#124) and the cpp_extension path interface for torch 2.6 and later (#121) are both merged.
This follows vLLM's platform design: CUDA-only kernels are gated on the platform object, not on the tensor's device type.
3.4 First run
vLLM-Omni merged native MAGI-2 support in early September (#5918). With torchada imported, the upstream code ran on vLLM 0.28 + vllm-musa with only a few per-platform changes: device strings and accelerator checks became platform checks, and two CUDA-only fast paths (vLLM's bundled FlashAttention extension and the Triton MoE that needs BF16 atomics) used PyTorch reference implementations until MATE and MUSA Triton were wired in. The first numbers come from 4-step diagnostic runs:
| Parallel configuration | Attention | Per step (4-step steady state) |
|---|---|---|
| SP4×CFG2 | MATE FA3 | 15.6 s |
| SP8×CFG1 | Torch | 17.9 s |
| TP4×SP2 | Torch | 23.5 s |
| TP4×SP2 | MATE FA3 | 17.7 s |
The SP8 profile shows that most of the time is not compute. Device kernels total 27.7 s, of which one MCCL broadcast kernel accounts for 16.3 s, mostly waiting on other ranks. BF16 tensor-core GEMMs take about 1.0 s; routing sorts, bincount and scalar syncs total about 6.8 s. The per-expert Python loop performs a host sync per expert. Hence the order: remove host syncs, then replace MoE and attention with real GPU kernels.
The first few runs produced almost entirely black frames. This was not a kernel bug: with only 1 or 4 denoising steps, the VAE output has a mean of about −1.1, which falls in the clamped range. Checking visual semantics requires running all 100 steps.
4. Optimizations along the execution path
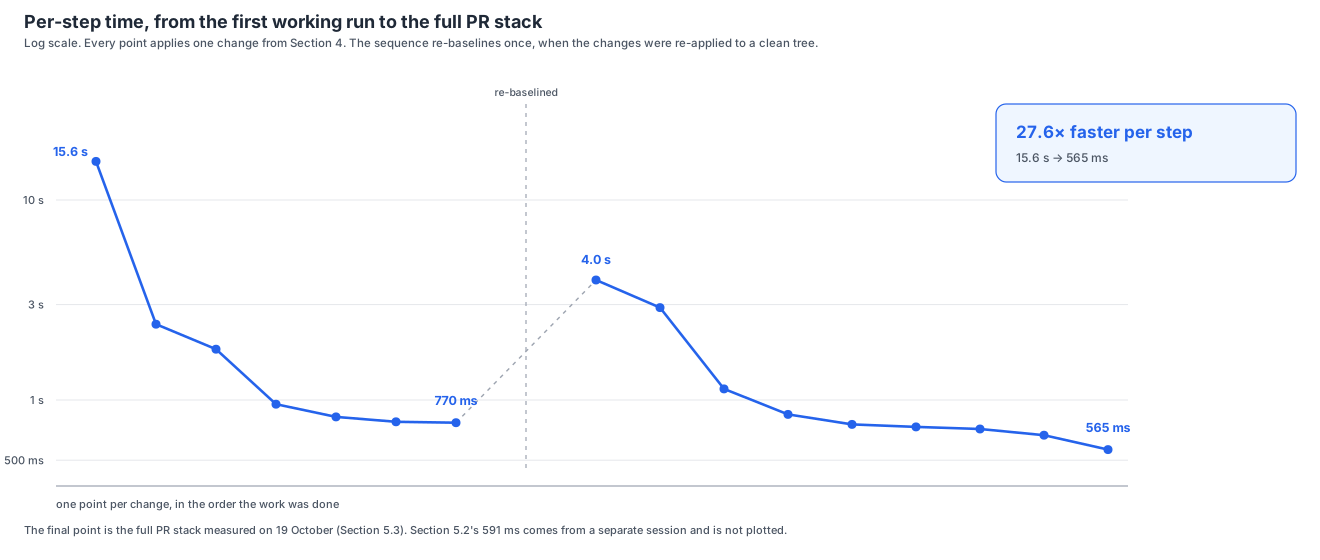
Figure 3: Per-step time (log scale) from the first working run to the stack this post measures: 15.6 s to 565 ms, 27.6× faster. The first point is the steady state of a 4-step diagnostic run, the rest are 100-step runs; each applies one change except the last, which is the full stack. The sequence re-baselines once, where the changes were re-applied to a clean tree, so only the final points describe the measured stack. All points: 8× MTT S5000; the last is the full PR stack of 19 October (Section 5.3). Section 5.2's 591 ms is from a separate session and is not plotted.
Per-step time fell from 15.6 s on the first working run to 565 ms on the stack this post measures, 27.6× overall. The path ran in two passes: a first pass that reached 770 ms under SP4×CFG2, then a re-implementation as upstream PRs whose baseline on a clean tree is 4.0 s. The figure marks that re-baseline, and only its last point describes the stack measured in Section 5. Each bullet below is measured against its own baseline, so the times do not descend from one bullet to the next.
4.1 Removing host syncs
- Per-expert
.item(): a single.tolist()replaces it, and per-step time under SP8 drops from 12.2 s to 8.8 s. Routing alignment later moved entirely onto the device, with fixed-capacity allocation and no readback to the host, saving about 99 ms more under SP8×CFG1+EP4. - Sequence-split metadata: each layer used
all_gatherto exchange per-rank token counts and then read them back. Passing them down from the caller reducesall_gathercalls from 39 to 3 per step and saves about 61 ms. torch.isfinite: on torch_musa 2.11, the finiteness check in attention waits for the device queue to drain, about 38.6 ms each time and 41 times per step. torchada computes the equivalentabs() < inffor MUSA floating-point tensors instead (#120), with identical results. Per-step time drops from 2,894 ms to 1,137 ms in that pass.
4.2 MoE: from a Python loop to one fused kernel
- MATE grouped GEMM: replacing the per-expert loop with MATE's ragged grouped BF16 GEMM takes a single projection from 21.9 ms to 0.69 ms, and per-step time from 14.4 s to 2.39 s.
- Fused W13 + SwiGLU7 Triton kernel: one kernel combines the routed gate/up GEMM and the SwiGLU7 activation, with tiling parameters tuned for MUSA, and per-step time drops below 1 s for the first time (1,464 → 954 ms, with the baseline from a 20-step run). This kernel later became #7206 and #7252.
- Pre-laid-out weights: storing W13 at load time in the interleaved layout the kernel needs removes the per-call transpose copy. Per-step time drops from 841 ms to 778 ms (−7.5%), with unchanged output. On main this corresponds to #8497: it keeps only one copy of W13, which also avoids storing an extra copy of the weights at load time.
- int32 counts (#8496): the routing histogram's
scatter_add_changes from int64 to int32. On MUSA, int32 is the faster path (0.071 ms vs 0.883 ms in an isolated test; about 39 ms per call for int64 in the model). With everything else unchanged, per-step time drops from 1,952 ms to 756 ms, with bit-identical output. The change applies to all platforms; its effect on CUDA was not measured. - K-dimension tiling (#8506): on MUSA,
BLOCK_SIZE_Kfor the two MoE GEMMs changes from 32 to 64, and CUDA is unchanged. Per-step time drops from 754.5 ms to 733.9 ms, with bit-identical output. - Route construction (#8592): routes are built deterministically with a sort plus
searchsorted, and the shared experts' SwiGLU7 is computed separately per projection, about −12 ms in total.
4.3 mHC: rewriting small GEMMs as elementwise contractions
Each mHC branch has a set of small FP32 operations: the [12288×24] projection, the 4×4 stream mixing, and 20 Sinkhorn iterations. On MUSA, elementwise contractions suit these better than small-K bmm, and a stream-major layout also saves one operand copy.
- In September we first integrated fused mHC mix and Sinkhorn kernels. Per-step time drops from 2,040 ms to 1,795 ms (−12%).
- The first commit of #8510 replaces small-K
bmmon MUSA with FP32 elementwise or per-stream contractions for the stream mixing and the projection. Per-step time drops from 984.7 ms to 733.6 ms (−25.5%). The summation order changes, so the output is no longer bit-identical; numerical tests against an FP64 CPU reference cover correctness. - The second commit of #8510 makes the mHC norm write its output directly in the "stream-major" layout. This saves 80 copies per step, about −24 ms, with bit-identical output.
- #8594 writes the 20 Sinkhorn iterations as one Triton kernel and plugs it into the compile path through
triton_op+wrap_triton: −6.6 ms.
4.4 Attention
- In September, attention moved from the chunked Torch implementation to MATE FA3. On the same code tree, the 100-step end-to-end time under SP4×CFG2 dropped from 2,271 s to 1,889 s (−16.8%).
- #8498 calls FA3 varlen to obtain the LSE, then adds the learned attention sink as an LSE correction in FP32.
- #8593 caches per-request RoPE, modality grouping, and sink-LSE metadata, about −6 ms in total.
- The attention kernel itself is already close to peak: in the profile, FA3 reaches 82–87% of the 500 TF/s BF16 peak of the 8-GPU configuration.
4.5 Head-sharded expert parallelism
MAGI-2's MoE routes per head, so expert parallelism is also sharded by head: with EP4, each GPU owns all experts of 3 heads. Sand AI's blog states: "Cross-device communication does not grow with Top-k for each head." EP8 would require padding the 12 heads to 16, which leaves 2 GPUs without a real head.
- #8511 decouples the EP degree from the SP degree. Under SP8×CFG1, per-step time is 864.6 ms with EP=SP=8 and 717.5 ms with EP4, and exchanging head-EP tokens across the whole SP group saves another 12.9 ms. On the newest tree the degree is measured rather than assumed: 697.8 ms with the explicit flag off (head sharding still follows the SP group), 565.0 ms with EP4 and 633.4 ms with EP8, all byte-identical (Section 5.3).
- #8595 removes the buffer copies around Ulysses send and receive: −10.6 ms.
- On the same 8 GPUs, SP8×CFG1+EP4 is faster than SP4×CFG2. Four-way Ulysses uses only 3 of the 7 links between GPUs (about 15 ms). The two CFG branches have different token counts (15,015 and 14,601), so running them on separate GPUs makes each wait for the other (about 10 ms).
4.6 Compilation
- Upstream regional compilation (#7174) compiles the repeated Transformer blocks; enabling it on MUSA took a few adaptations. On the early-October code tree, regional compilation cuts per-step time by about 16% compared with eager.
- vLLM-Omni defaults to
dynamic=True, so every dimension is symbolic and the attention output-gate kernel does 64-bit index arithmetic per element. Pinning the non-token dimensions throughtorch._check(#8627) drops that kernel from 1,429 µs, plus a 212 µs copy, to 55 µs, and removes the copy. #8595 changes this layout, so trees carrying it use that PR's own fix (2,628 → 39 µs). No end-to-end dynamic-compile delta is reported: the baseline predates #8594, whose dynamic output was invalid. - Dynamic compilation on MUSA needs #8594 to be correct. The MUSA Triton toolchain (Triton 3.2.0, mcc 5.2.0) miscompiles one fused pointwise kernel of the dynamic-shape
_moe_outputregion: every token after the first is wrong and the video decodes to noise. Static-shape regions compile correctly, and #8594 keeps the last Sinkhorn division outside that kernel, which makes dynamic output bit-identical to static. The static results here do not depend on it; #8915 makes the MUSA transformer regions compile with static shapes by default.
5. Measured results
5.1 The PR tree, end to end
These results are measured under the conditions in Section 2.1 (ms/step; multiple runs are listed separately):
| Parallel configuration | Before the last optimization round (static) | Static compilation | Dynamic compilation (default) |
|---|---|---|---|
| SP8×CFG1+EP4 | 714.1 / 714.9 | 665.7 / 669.9 | 678.3 / 678.9 / 683.7 |
| SP4×CFG2+EP4 | 732.6 | 690.8 | Not measured |
| SP4×CFG2 | 783.1 | 729.9 | Not measured |
"Before the last optimization round" is the tree without #8592–#8595, without the second commit of #8510 and without the fourth commit of #8511. Its dynamic-compilation column uses the equivalent fix from #8595, adapted to that layout (Section 4.6). The fastest configuration on this tree is SP8×CFG1+EP4, about 668 ms static and about 680 ms dynamic. That column is only meaningful because the tree carries #8594; the earlier tree has no dynamic number, its dynamic output being invalid (Section 4.6).
- These numbers require four PRs that are still open (#8511, #8593–#8595). Main with only merged PRs has not been fully measured on MUSA.
- For the tree a reader would run today (main plus #8595), static compilation measures 670.2 ms per step with identical output. The 665.7 / 669.9 runs above predate that fix and are kept for comparison.
- On 19 October, with every PR of this post applied, the same workload measures 565 ms per step (Section 5.3). That is a different tree measured in a different session, so no delta against the rows above is claimed.
- Compare only within one row and one compilation mode. Different parallel configurations differ in communication volume and load balance.
5.2 Splitting the W13 accumulators (#8855)
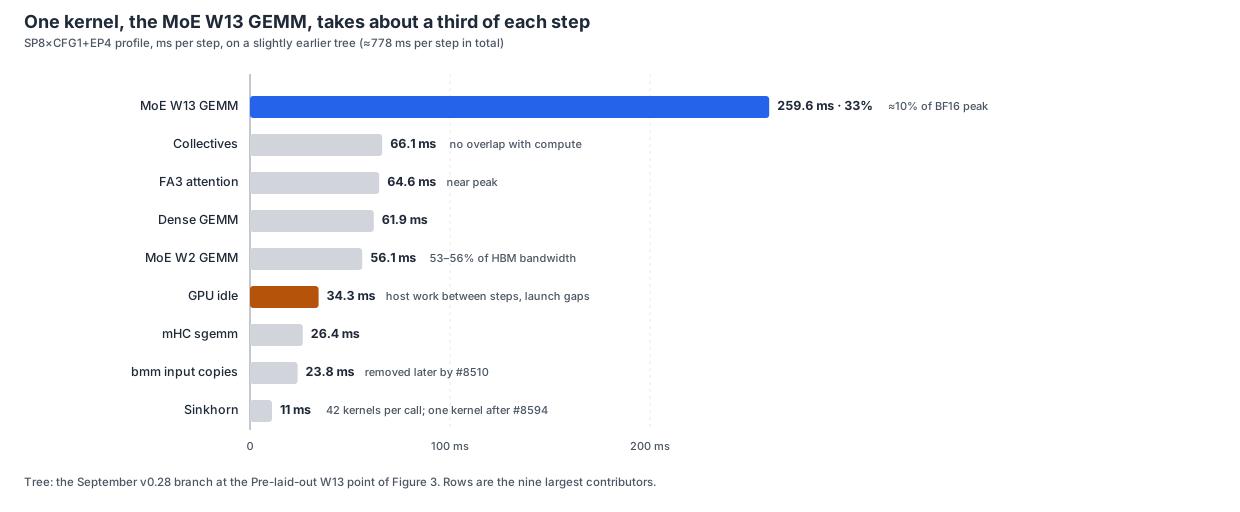
Figure 4: Per-step time breakdown for SP8×CFG1+EP4, from a slightly earlier code tree (about 778 ms per step in total). #8510 (merged) removes the bmm input copies, and #8594 (in review) fuses the 42 Sinkhorn kernels launched per call into one. #8855 (Section 5.2) splits the W13 accumulator and takes about 40% off that kernel. Source: torch profiler measurements by the authors.
W13, the fused gate/up GEMM, is the largest MoE GEMM of a step — about a third of one in Figure 4. At the MUSA launch config (BM 128, BN 128, BK 64, 16 warps, 1 stage) the shipped kernel accumulates the interleaved gate and up rows in one FP32 shared-memory tile, and the SwiGLU7 epilogue reads from that tile, which limits how many programs stay resident on an MP. #8855 keeps gate and up in two half-width accumulator tiles instead, so the epilogue runs on registers with no spills; routing, masks and padded-block handling are unchanged. The kernel alone is 38.8–40.3% faster on all 13 captured calls, at 50.2 → 82.9 TF/s, and a 40% cut on a kernel worth about 260 ms per step is about 100 ms — the same size as the 99.5 ms measured end to end.
End to end on 8× MTT S5000 at SP8×CFG1+EP4, 272p, 100 steps, static compilation, alternating control and candidate within one session:
| Tree | Static compilation (ms/step) | Output hash (audio / video, sha256, first 10 hex chars) |
|---|---|---|
| main + #8511 + instrumentation (control) | 690.8 / 691.1 | 32f1b4fca4 / 44b9747e9e |
| control + #8855 | 591.3 / 590.4 | identical |
The two sides are two launches each and all four runs share one output hash, so the 14.5% reduction is bit-identical. This A/B is a single session, so its absolute numbers are compared only within these rows: the control here is 690.8 ms, while Section 5.1 measured 665.7 ms on a different tree, and the two are not converted into each other. The tree predates #8592–#8595, whose gains were measured incrementally on the earlier tree; whether they add here has not been re-measured as a pair, though a tree carrying all of them is measured in Section 5.3.
The clip is generated with the benchmark's prompt and seed under the sample settings Section 6 describes, to show the visuals and sound. It is not the output of a timed run.
5.3 The newest tree: what the EP degree is worth
On 19 October the whole PR set — #8511, #8592–#8595, #8855, the refiner branch of #8915, and the per-step instrumentation — was measured under the conditions of Section 2.1, on a tree that had never been executed before. The refiner branch is in the tree but 272p does not execute it. Per step as defined in Section 2.1, the 272p, 100-step, static-compilation time is:
| Parallel configuration | Mean of the per-step times (ms) | vs EP4 | Output |
|---|---|---|---|
| SP8×CFG1, expert-parallel flag off | 697.8 | +23.5% | reference |
| SP8×CFG1+EP4 | 565.0 | — | identical |
| SP8×CFG1+EP8 | 633.4 | +12.1% | identical |
With --enable-expert-parallel off, MoE head sharding does not turn off: get_magi2_ep_group() falls back to the TP group when TP is greater than one and to the Ulysses group when it is one, so at SP8 this arm still shards the head bank eight ways. It is the legacy layout in which head parallelism overlaps Ulysses, not an unsharded control. The three arms differ only in --enable-expert-parallel and --expert-parallel-size; the run banner records the resolved configuration (ulysses_degree, cfg_parallel_size, enable_expert_parallel, expert_parallel_size).
Three runs of the EP4 configuration — the first on a tree that had never run, its immediate repeat, and one inside this comparison — give 565.0, 566.3 and 565.0 ms, so the run-to-run spread is 1.3 ms (0.2%). All three parallel configurations produce the same audio (3188e16c3487fc50…, sha256) and the same images (61e6da48517e0d0f…), so the difference between them is not a numerics trade-off.
This sweep adds the flag-off control to the EP4-versus-EP8 comparison of Section 4.5, on the newest tree, and it separates two effects. At equal eight-way sharding, the explicit head-EP path is faster than the legacy SP-coupled layout: 633.4 against 697.8 ms. And at that same path, fewer shards are better: EP4 is 68.4 ms faster than EP8. Before the sweep, EP4 was the configuration every best number happened to use — the 864.6 against 717.5 ms pair was eight shards against four, so both of those shard counts were known, while neither the flag-off arm nor EP8 at a fixed SP degree had been measured. EP8 is not a faster configuration at this size; #8915 applies it for memory, not for speed.
Two caveats. The no-EP and EP8 configurations were each measured once and EP4 three times, so only EP4 has run-to-run spread evidence. And this is not a paired A/B against Section 5.1: it is a later tree measured in a later session, and no delta between 565 ms and 670 ms is claimed. The changes in between are the PRs of Section 4, each of which carries its own paired measurement.
6. Generated samples and quality boundaries
All videos below are generated with the benchmark settings on 8× MTT S5000: 10 seconds, 125 frames, 12.5 fps, 100 steps, seed 42, default CFG (video 5.0 / audio 7.0), and the default negative prompt. The model generates the audio together with the visuals, with no post-production dubbing. Each prompt is generated once, without cherry-picking. One setting differs from the timing tree of Section 5: the samples use dynamic compilation on a tree that carries #8594, so the output is valid (Section 4.6), and were generated in a separate session. They serve only as visual and audio samples.
vLLM-Omni implements the Preview stage of MAGI-2; the refiner that Sand AI uses for 1080p output is in review as #8915, so these frames cannot be compared directly with the 1080p samples on Sand AI's website.
6.1 Sand AI official prompts
The prompts come from assets/demo_samples.json in Sand AI's repository: two long prompts, each run once as T2VA and once as I2VA, plus one T2VA prompt with dialogue. As in Sand AI's entry-point script, each prompt file is passed to the model as-is after stripping leading and trailing whitespace. Each prompt is about 9,000–11,000 characters long and describes the visuals, camera, and sound design in separate sections.
| Sample | Prompt file | Content | Sound design |
|---|---|---|---|
| Coffee shop | sample_enhanced_t2v.json | A street-corner coffee shop on a rainy day; the barista sets a cup on a tray and says one line to a customer as the camera pushes in | One line of English dialogue, "Careful, it's still very hot.", plus ambient sound |
| Animation | sample_000.txt | Japanese anime style; a girl runs from a misty forest to a clearing that overlooks the sea | Ambient sound only, with no dialogue or music |
| Clay animation | sample_001.txt | A small clay figure searches a room for a lost red ball and finally finds it at its feet | Ukulele and xylophone score plus Foley, with no dialogue |
T2VA uses SP8×CFG1+EP4. I2VA uses SP4×CFG2: the offline image-to-video script used for these samples cannot set the EP degree separately on that tree, so the MoE heads are sharded with EP=SP=4, and each GPU again owns 3 heads.
| Sample | T2VA · 272p · SP8×CFG1+EP4 | I2VA · 272p · SP4×CFG2 |
|---|---|---|
| Coffee shop | no still ships with this prompt | |
| Animation | ||
| Clay animation |
Each clip is 10 s. The I2VA runs condition on the still that ships with the same prompt (sample_000.jpeg for Animation, sample_001.jpeg for Clay animation); the coffee-shop prompt ships without a still, so it has no I2VA run. The T2VA runs use the prompt alone.
6.2 540p
SP8×CFG1+EP4 has enough memory to run 540p. In the session that generated these samples, per-step time under dynamic compilation is about 3.9 s (about 0.9 s at 272p for the same prompt). 540p has not been benchmarked on the timing trees of Section 5; a later 100-step static run has since measured about 3.6 s per step, so both numbers are for reference only: they differ in tree and in compilation mode, and are not comparable with each other.
6.3 Quality checks
| Sample | Frames | Duration | Resolution / fps | Audio |
|---|---|---|---|---|
| 272p samples (6 clips: the benchmark clip in Section 5.2 and the five in Section 6.1) | 125 | 10.0 s | 448×256 / 12.5 | AAC 44.1 kHz stereo |
| 540p sample | 125 | 10.0 s | 896×512 / 12.5 | AAC 44.1 kHz stereo |
| Quality check | Status |
|---|---|
| Media structure | Frame count, duration, resolution, and H.264 + AAC all match expectations; video and audio signals are nonzero |
| Prompt adherence | Manual review: the content of all 7 videos matches the prompts, and the I2VA first frames match the reference images |
| Dialogue | Manual listening: the English line in the coffee shop sample is audible |
| Comparison with Sand AI 1080p samples | Not comparable: these clips are the Preview stage only; the refiner is in review as #8915 |
| Multi-seed quality evaluation | Not yet done |
7. Upstream status and compatibility boundaries
7.1 Upstream merge status
| PR | Content | Status | Measured effect (per step unless the row says otherwise) | Notes |
|---|---|---|---|---|
| #7206 | Fused BF16 MoE (Triton) | Merged | — | The W13 GEMM with its SwiGLU7 epilogue |
| #7243 | Configurable Dynamo recompile limit | Merged | — | Required for regional compilation |
| #7252 | Fused SwiGLU7 | Merged | — | — |
| #7261 | Fused mHC post | Merged | — | — |
| #8496 | int32 routing counts | Merged | 1,952 → 756 | Against the int64 version |
| #8497 | Fused MoE keeps only one copy of W13 | Merged | — | Avoids running out of memory at load time |
| #8498 | MUSA support: FA3 varlen + sink correction, platform checks | Merged | — | Platform support |
| #8506 | BLOCK_SIZE_K=64 for MoE GEMMs on MUSA | Merged | 754.5 → 733.9 | CUDA configuration unchanged; the W13 kernel alone is −5.8% |
| #8510 | mHC FP32 contractions; norm writes stream-major output | Merged | 984.7 → 733.6; −24 | First commit; second commit |
| #8511 | Head-sharded EP, EP degree independent of SP | Open | 864.6 → 717.5 | EP=SP=8 vs EP4; on the newest tree 697.8 (flag off) → 565.0 (EP4) → 633.4 (EP8) at SP8 (Section 5.3) |
| #8592 | Bit-exact route build, token-major routes | Merged | −12 | Merged October 19 |
| #8593 | RoPE, modality grouping, and sink-LSE metadata caching | Open | −6 | — |
| #8594 | Single-kernel Sinkhorn | Open | −6.6 | — |
| #8595 | Remove Ulysses buffer copies | Open | −10.6 | Static compilation |
| #8627 | Pin the attention-head layout under dynamic compilation | Merged | 1,429 → 55 µs (gate kernel) | Dynamic compilation; merged October 17, after these measurements |
| #8855 | Split the gate/up accumulators of the W13 GEMM on MUSA | Open | 690.8 → 590.4 (static) | −14.5%, bit-identical; separate session (Section 5.2) |
| #8915 | 1080p refiner: block-window attention, residency, static shapes on MUSA | Draft | — | Adds the 1080p tier |
| #7274 | Per-step timing boundary | Closed | — | Superseded: the boundary now comes from measurement-only instrumentation (Appendix A.3) |
Statuses are as of October 28, 2026. On the torchada side, #120, #121, #124, and #125 are merged. MUSA progress in vLLM-Omni is tracked in RFC #2347, which covers platform integration, FA3 from MATE, the adapted models, the CI plan, and the MAGI-2 PRs.
7.2 Compatibility boundaries
| Combination | Status in this post |
|---|---|
| MUSA + SP8×CFG1+EP4, 272p | Benchmarked (Sections 5.1–5.3) |
| MUSA + SP4×CFG2 / SP4×CFG2+EP4, 272p | Benchmarked (Section 5.1) |
| 540p | Samples generated; benchmarked only outside the timed sessions (Section 6.2) |
| I2VA | Samples generated (SP4×CFG2); not yet benchmarked |
| Main with only merged PRs | Not yet measured on MUSA; requires a newer vLLM image |
| MUSAGraph | Captures correctly, with consistent output; regional compilation without graph replay is currently faster, so this post does not use graph replay |
| Layerwise offload (DLO), quantization, Cache-DiT | Not yet validated on MUSA |
| 1080p refiner | Draft as #8915 (refiner stage, block-window attention, residency); still tracked in RFC #5949 |
8. Conclusion and future work
With torchada, MAGI-2 Preview on MUSA reuses vLLM-Omni's existing implementation. CUDA-style PyTorch code, the Inductor compilation path, and distributed communication are reused directly. The Triton kernels differ only in per-platform launch configuration and path selection, and the platform-specific handling is concentrated in a few places. On top of that, optimizations along the execution path took the September bring-up from 15.6 s to 770 ms per step; with every PR in this post applied, the newest measurement is 565 ms per step (Section 5.3), and the last round is a 14.5% step-level reduction on the October tree, against its own control and bit-identical (Section 5.2). The 27.6× of Section 4 describes the work as a whole, not two code states against each other. These changes went upstream as PRs; some are merged, the rest are in review.
The first three items below come from Figure 4; dynamic compilation was measured in isolated tests, and the rest is platform and feature-coverage work:
- MoE W13 GEMM: the fused SwiGLU7 epilogue used a large amount of shared memory, which limited the number of blocks resident at the same time on each MP (MUSA's multiprocessor, the counterpart of an SM in CUDA). #8855 does this: gate and up accumulate in separate tiles and the epilogue runs on registers, and the kernel is 38.8–40.3% faster (Section 5.2). What remains is the GEMM itself, still latency-bound at about 83 TF/s. Three bit-exact options were costed from the profile but not taken here: a 128-wide K tile (2–3 ms/step), a sorted intermediate (0–7 ms/step), and a purpose-built grouped kernel through MATE (0–140 ms/step, by far the most work).
- Communication-compute overlap: with EP4, the 60–90 ms of collective communication per step does not yet overlap with compute.
- Idle time between steps: FlowUniPC's host computation between steps takes about 19 ms, and launch gaps inside the forward pass take about 14 ms.
- Dynamic compilation: other kernels still perform int64 size arithmetic; in isolated tests, passing the sizes as int32 recovers about 85% of that overhead.
- Graph replay on MUSA: MUSAGraph already captures MAGI-2's regional graphs correctly. In September, per-step time was 3,601 ms with graph replay enabled (972 ms without); graph replay tuning is left for later work.
- CI and coverage: a self-hosted 8× MTT S5000 runner and a MUSA CI pipeline are part of the RFC #2347 plan. 540p benchmarking and measuring main with only merged PRs are also follow-up work.
- 1080p refiner: Sand AI's default 1080p output has two stages. The Preview DiT first generates 540p, then a separate 6.7B dense refiner (30 layers, block-window local attention, 5 steps) raises the video to 1920×1088 at 25 fps, reusing the audio from the Preview stage. vLLM-Omni implements the Preview stage today, and the refiner stage is in review as #8915. On MUSA, the refiner needs an implementation of block-window local attention and a memory plan for holding both the Preview and refiner weights. This post optimizes the Preview DiT; measuring the 540p Preview stage is the first step toward 1080p.
A few lessons that also apply to the next model:
- Find host syncs first, then look at kernels. Per-expert
.item(), per-layerall_gatherplus readback, and a finiteness check are all easy to fix. The.item()and finiteness-check fixes are among the largest gains. - Optimize for the local shape after sharding. With EP4, each GPU holds the experts of only 3 heads, and the GEMM K is only 256. Tiling and fusion choices have to be measured at that shape.
- Put a correctness check next to every performance number, and confirm that the check is actually in effect.
- Gate CUDA-only kernels on the platform object, not on the tensor's device type. torchada maps tensor semantics on purpose so that CUDA code runs as usual.
- Put fixes that can live in the compatibility layer into the compatibility layer. The
isfinitefix lives in torchada, so other torchada-based frameworks benefit as well.
Acknowledgments
We thank Sand AI for open-sourcing MAGI-2 Preview and for providing the official sample prompts in its repository.
The MUSA support and optimizations for MAGI-2, the vLLM-Omni PRs in this post, and the torchada fixes are by @yeahdongcn (R0CKSTAR).
We thank @hsliuustc0106 for implementing native MAGI-2 Preview support in vLLM-Omni and for reviewing and merging the MAGI-2 PRs in this post. We thank @cr-gao for implementing regional compilation, @IDEA-V for fusing MAGI-2's multi-head MoE route construction in #7175, and @Dong1017 for independently validating the MAGI-2 kernels and the MUSA-related PRs on H200 (and #7261 also on Ascend). We also thank @RuixiangMa, @SamitHuang, @wtomin, @lishunyang12, @alex-jw-brooks, and @daii-0818 for reviews and discussion; and @gcanlin and @lishunyang12 for their support in the MUSA RFC #2347.
We thank the Moore Threads MATE, torch_musa, and torchada teams for FlashAttention-3 and grouped GEMM, the PyTorch backend, and the torchada CUDA compatibility layer.
Appendix A. Reproduction
A.1 Timing boundaries
| Boundary | Scope |
|---|---|
| Per step | One denoising step of the sampler loop, maximum across the 8 ranks, averaged after dropping steps 0 and 1 |
| Instrumentation | A measurement-only patch (Section A.3); it belongs to no PR |
| Generated samples | Only wall-clock time and approximate per-step time are recorded; not used as performance results |
| Profile | Separate diagnostic runs; they do not replace uninstrumented per-step time |
A.2 The container image
The stack ships as one image, so the reader does not have to assemble a source tree:
| Item | Value |
|---|---|
| Image | registry.mthreads.com/mcconline/inference/vllm/vllm-omni:magi-2-preview |
| Digest | sha256:2785b4626d1da1e0765a4cb515b9afc5349a22c6417e14c81091add0c1a9b902 |
| Source | 79877f3ce, which is upstream main at 0f7a408c3 plus #8511, #8593, #8594, #8855, #8595 and #8915 |
| Runtime | vLLM 0.32.0, torch and torchvision 2.11.0.post2+musa5.2.0, Triton 3.2.0 |
| Tools | /opt/magi2/magi2_e2e_gate.py, /opt/magi2/instrument-steps.py, /opt/magi2/KNOWN-LIMITATIONS.md |
The image pins a later tree than the tables: Sections 5.1–5.3 measure the trees they cite, and the image is the tree on which the same method was last run. No number in it is compared with those tables. Weights are not in the image, and no compatibility layer for vLLM is needed on this base.
docker pull registry.mthreads.com/mcconline/inference/vllm/vllm-omni:magi-2-preview
docker run -d --name magi2 -v /ipfs:/ipfs -v "$PWD/magi2-out":/work \
  --entrypoint sleep registry.mthreads.com/mcconline/inference/vllm/vllm-omni:magi-2-preview infinity
MUSA_VISIBLE_DEVICES selects the cards inside the container, as in any MUSA container.
A.3 The timed run
The gate is the entry point, and it takes the parallel and shape flags directly, including --compile-static. Two steps inside the container — the instrumentation, then the run:
docker exec magi2 bash -lc '
  cd /opt/vllm-omni-src
  python /opt/magi2/instrument-steps.py
  VLLM_WORKER_MULTIPROC_METHOD=spawn PYTHONUNBUFFERED=1 \
  python /opt/magi2/magi2_e2e_gate.py \
    --ulysses-degree 8 --cfg-parallel-size 1 \
    --enable-expert-parallel --expert-parallel-size 4 \
    --resolution 272p --height 256 --width 448 \
    --seconds 10 --fps 12.5 --num-frames 125 --num-inference-steps 100 \
    --no-pin-cpu-memory --metrics-dir /work/steps --save-outputs /work/outputs'
The gate aggregates the way Section 2.1 defines the metric — per step the slowest rank, steps 0 and 1 dropped, the rest averaged — writes one JSONL record per rank and step under --metrics-dir, and a manifest.json with per-array sha256 under --save-outputs. On 8× MTT S5000 this workload measured 566.8 ms per step, and a repeat measured 565.7 ms.
Notes:
- The instrumentation ships unapplied. Earlier per-step timings came from
Magi2PreviewSampler.denoise_step, and the sampler restructure removed that method, so the per-step series for this stack comes from a patch thatinstrument-steps.pyapplies tosampler_magi2.pyinside the container. Without it the gate reports stage totals andno step records. It edits the installed source in place, is idempotent, and synchronises outside the timed region. - Compilation. #8915 makes the MUSA transformer regions compile with static shapes even when
diffusion_compile_dynamicis true (Section 4.6), so--compile-staticstates that explicitly and changes nothing on MUSA. - Expert parallelism.
--expert-parallel-sizemust be at least 4 on 8× 80 GB: at 2, loading runs out of memory (960 MiB requested against 723 MiB free on the fullest card).MAGI2_EP_SIZEhas no effect in this stack; that environment variable creates no groups. Turning the flag off does not turn head sharding off — with TP=1 the MoE head axis falls back to the Ulysses group (Section 5.3). --no-pin-cpu-memoryis required here. With the default, the pinned-memory stager raises an apparent MUSA OOM after the roughly 60 GiB of weights are already resident.- Hashes are the stronger check. The parallel configurations of Section 5.3 produce the same audio and image arrays, so a run that reproduces the hash reproduces the computation, not only the timing.
A.4 Other resolutions and the samples
# 540p (896×512)
docker exec magi2 bash -lc 'cd /opt/vllm-omni-src && python /opt/magi2/magi2_e2e_gate.py \
  --ulysses-degree 8 --cfg-parallel-size 1 --enable-expert-parallel --expert-parallel-size 4 \
  --resolution 540p --height 512 --width 896 \
  --seconds 10 --fps 12.5 --num-frames 125 --num-inference-steps 100 \
  --no-pin-cpu-memory --save-outputs /work/540p'

# 1080p, with the refiner
docker exec magi2 bash -lc 'cd /opt/vllm-omni-src && python /opt/magi2/magi2_e2e_gate.py \
  --ulysses-degree 8 --cfg-parallel-size 1 --enable-expert-parallel --expert-parallel-size 4 \
  --resolution 1080p --height 1088 --width 1920 \
  --seconds 10 --fps 25 --num-frames 249 --refiner-num-inference-steps 5 \
  --vae-patch-parallel-size 8 --no-pin-cpu-memory --save-outputs /work/1080p'
At 1080p, --vae-patch-parallel-size 8 is not optional: with the default of 1 the run dies during decode without a traceback (Stage-0 inline diffusion engine is dead), and the cause of that one-card failure is not established. The resolution check accepts 1080p only with the exact 1920x1088 pair. Sample prompts and images go through the same gate: --prompt or --prompt-file for T2VA, --image with --prompt for I2VA. The prompt and image files must be visible inside the container.
A.5 Bit-identical check
Some Inductor choices (reduction configs, GEMM padding) are made by benchmarking at compile time, so the same code with a fresh compile cache can produce a different output hash. TORCHINDUCTOR_DETERMINISTIC=1 has no effect here: the MAGI-2 pipeline calls torch.use_deterministic_algorithms(False) during construction, which turns it off before the first compilation. The measurements in this post use these settings:
export TORCHINDUCTOR_FORCE_FILTER_REDUCTION_CONFIGS=1  # keep only one config per reduction
export TORCHINDUCTOR_CACHE_DIR=$(mktemp -d)            # use a fresh cache for every run
export TORCHINDUCTOR_DETERMINISTIC=1                   # set, but has no effect, as explained above
Under these settings, whether a GEMM is padded (pad_mm) is still decided by benchmarking. With these settings, identical hashes prove identical outputs; different hashes do not prove that the values changed and need further checking. Keeping only one reduction config has no measurable performance cost on its own (697.8 ms, against 700–703 ms for the control).
References
- vLLM-Omni
- MAGI-2 Preview blog, model card, SandAI-org/MAGI-2-preview
- mHC paper (arXiv 2512.24880)
- vLLM-Omni native MAGI-2 support #5918, regional compilation #7174, fused multi-head MoE route construction #7175
- Native MAGI-2 Preview architecture RFC #5949
- MUSA support roadmap RFC #2347
- torchada
- torch_musa
- MATE (MUSA AI Tensor Engine)
- vllm-musa